CapitaLand Limited C31 Stock Chart
MA is a great visual tool for charting software. MA slop up and price action bounce up, bullish. MA slop down and price action bounce down, bearish. Picture worth a thousand words. You can find both bullish and bearish trend on the same chart.
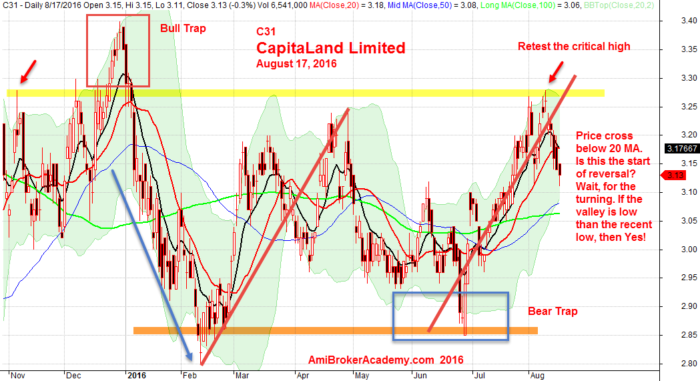
August 17, 2016 CapitaLand Limited Daily Chart
AmiBrokerAcademy.com
Disclaimer: All information, data and material contained, presented, or provided on amibrokeracademy.com is for educational purposes only. It is not to be construed or intended as providing trading or legal advice. Decisions you make about your trading or investment are important to you and your family, therefore should be made in consultation with a competent financial advisor or professional. We are not financial advisor and do not claim to be. Any views expressed here-in are not necessarily those held by amibrokeracademy.com. You are responsible for your trade decision and wealth being.