September 24 2016
See below the chart the data from before 1988. Imagine, how long Chuan Hup Holdings has been around? The company has gone through many round of recession, the lowest of the stock price was 0.024 on 9 April 1998 and the peak at 0.46 on 13 July 2007. Just a bit of advertisement for AmiBroker charting software. Only with software as such then you can easily plot the chart as far back as you have the data. Besides that you much also has the data source. The data comes from DataFolio Technical Analysis LLP.
Just wonder why Chuan Hup did not bring the company back into private when the stock price was so low and advantage to company.
Chuan Hup Holding Weekly Chart Before 1988
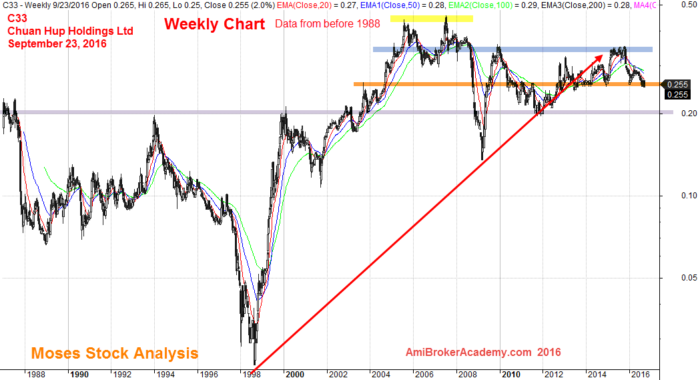
23 September 2016 Chuan Hup Holding Data Before 1988
Chuan Hup Holding Stock Analysis
Picture worth a thousand words, the stock price remain bearish. The stock price crossed below MAs in 2015, and the stock price remains bearish. The stock price did pull back to 20 MA but got resisted by it and bounced off.
See chart for the analysis. Have fun!
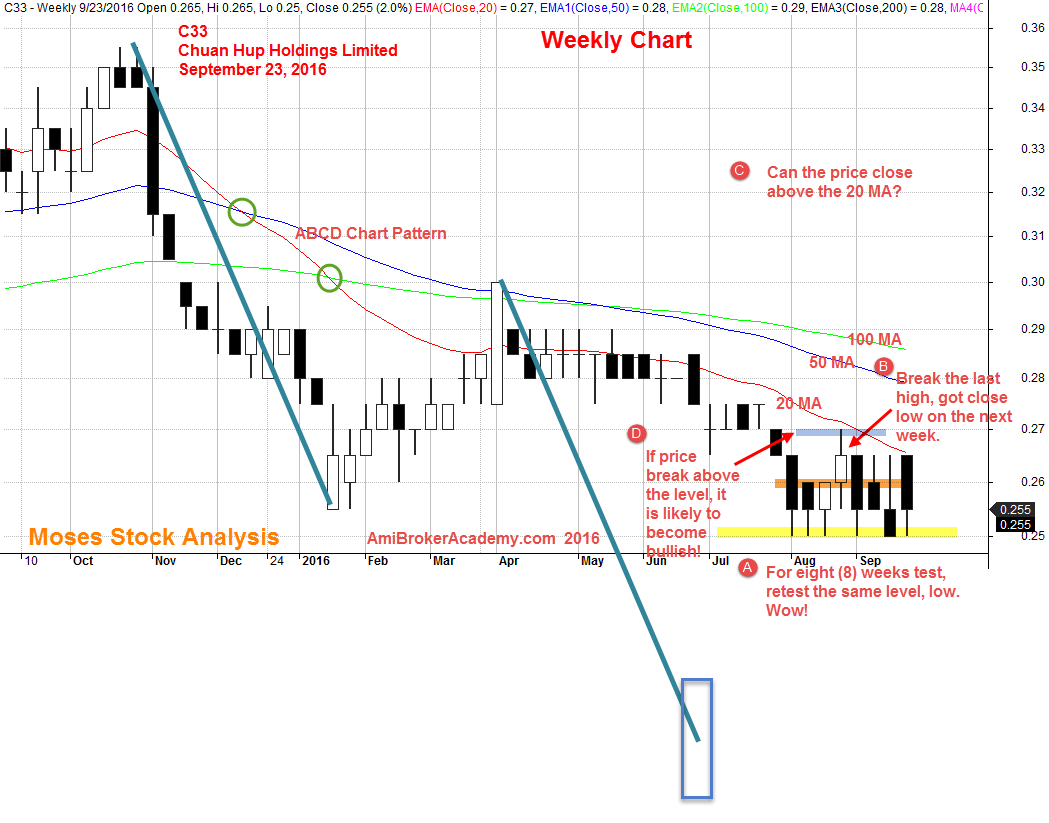
September 23, 2016 Chuan Hup Holding Weekly Chart
Moses Singapore Stock Analysis
AmiBrokerAcademy.com
Disclaimer: All information, data and material contained, presented, or provided on amibrokeracademy.com is for educational purposes only. It is not to be construed or intended as providing trading or legal advice. Decisions you make about your trading or investment are important to you and your family, therefore should be made in consultation with a competent financial advisor or professional. We are not financial advisor and do not claim to be. Any views expressed here-in are not necessarily those held by amibrokeracademy.com. You are responsible for your trade decision and wealth being.