19 October 2016
It is good idea to learn a few analytic methods. If you get stuck with one, try the others.
DBS Group Holdings Charting and Wave
Trading is easy, buy support and sell resistance. Buy low and Sell high. What have you see from the chart below? Price near support or resistance?
Price trapped in wave, wave is flat, the direction is very unclear. When not sure, stay aside and wait for the a clearer direction.
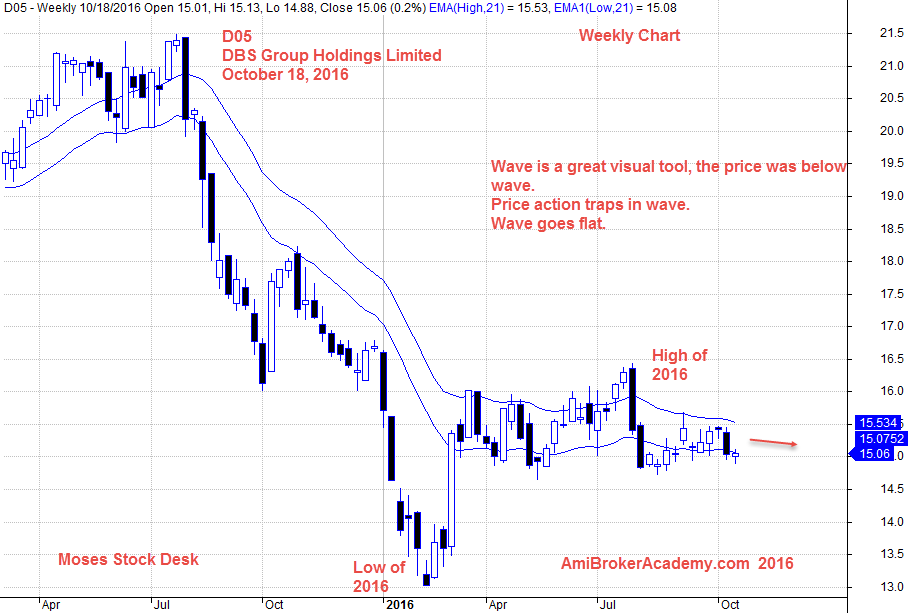
October 18, 2016 DBS Group Holdings and Wave Weekly CHart
DBS Goup Holdings and MACD
Just like driving, you must learn the road signs. Besides that you must appreciate the “traffic conditions”. See bull trap, ranging or sideways.
You have to regulate your investment and not just driving at a high speed. When road is bad, drive slowly.
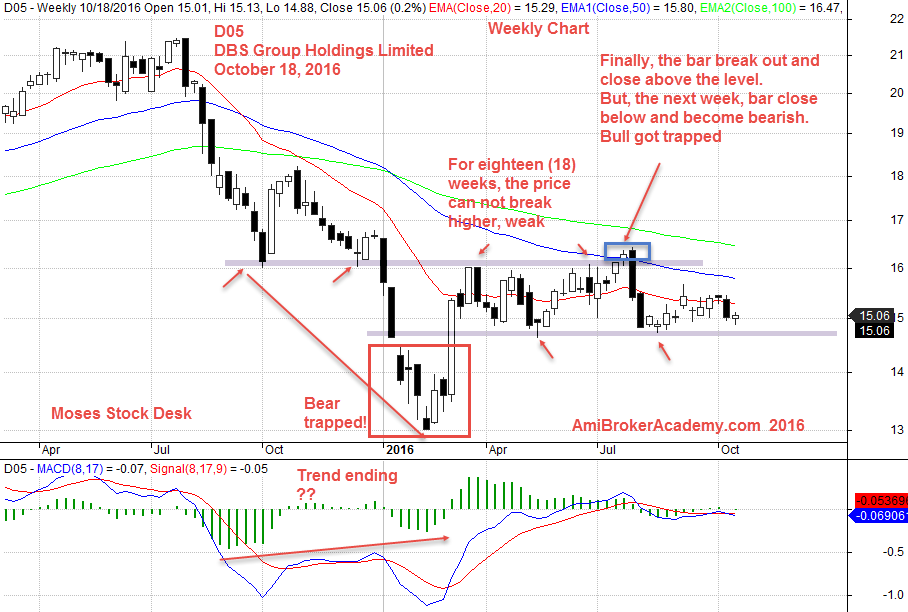
October 18, 2016 DBS Group Holdings and MACD Signals
DBS Group Holdings and ABCD Chart Pattern
Setup can fail, it is so easy to see others make money. Sell at ABCD chart pattern and so on. What if ABCD fail? Re assess again.
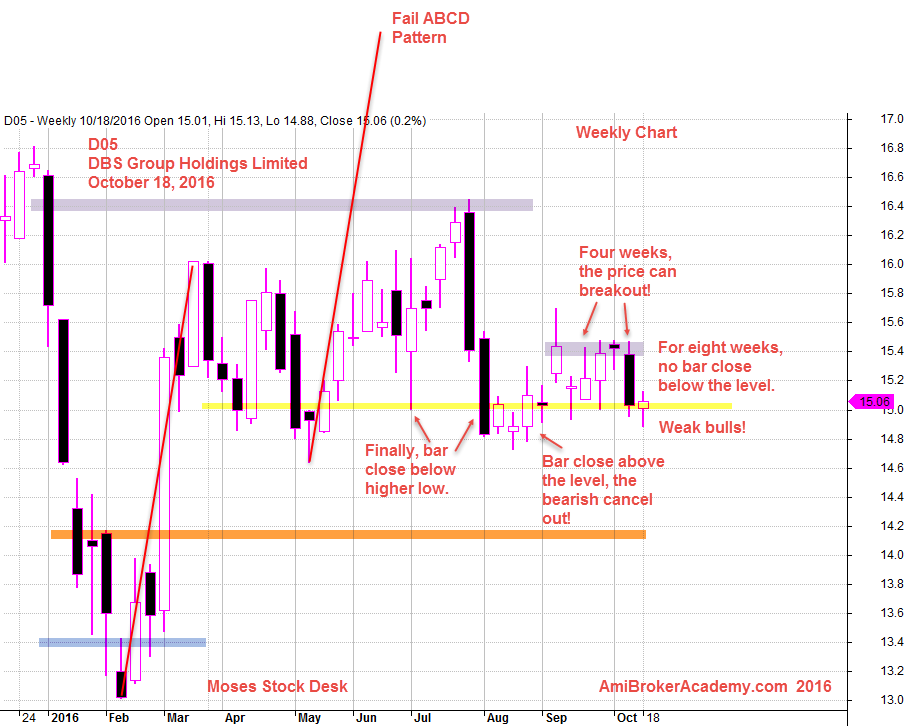
October 18, 2016 DBS Group Holdings and ABCD Chart Pattern
Have fun!
Moses Stock Desk
AmiBrokerAcademy.com
Disclaimer: All information, data and material contained, presented, or provided on amibrokeracademy.com is for educational purposes only. It is not to be construed or intended as providing trading or legal advice. Decisions you make about your trading or investment are important to you and your family, therefore should be made in consultation with a competent financial advisor or professional. We are not financial advisor and do not claim to be. Any views expressed here-in are not necessarily those held by amibrokeracademy.com. You are responsible for your trade decision and wealth being.