22 September 2016
What have you see from the chart? I see many black candlestick, big one. I see price sliding down from left upper end to right bottom. I see bar start to bounce up after hitting the bottom. Okay enough, so what is your conclusion? Buy? Sell? Or stand aside.
Okay, another view, I see the price cross below 20 MA, stay below 20 MA. Since July the price cross above 20 MA. So the conclusion is the price when bearish to bullish. So, what is your trading strategy? Buy? Sell?
One View
Picture worth a thousand words. See chart for all I see in another view. Buy after the price pullback and retest the level drew. Have fun!
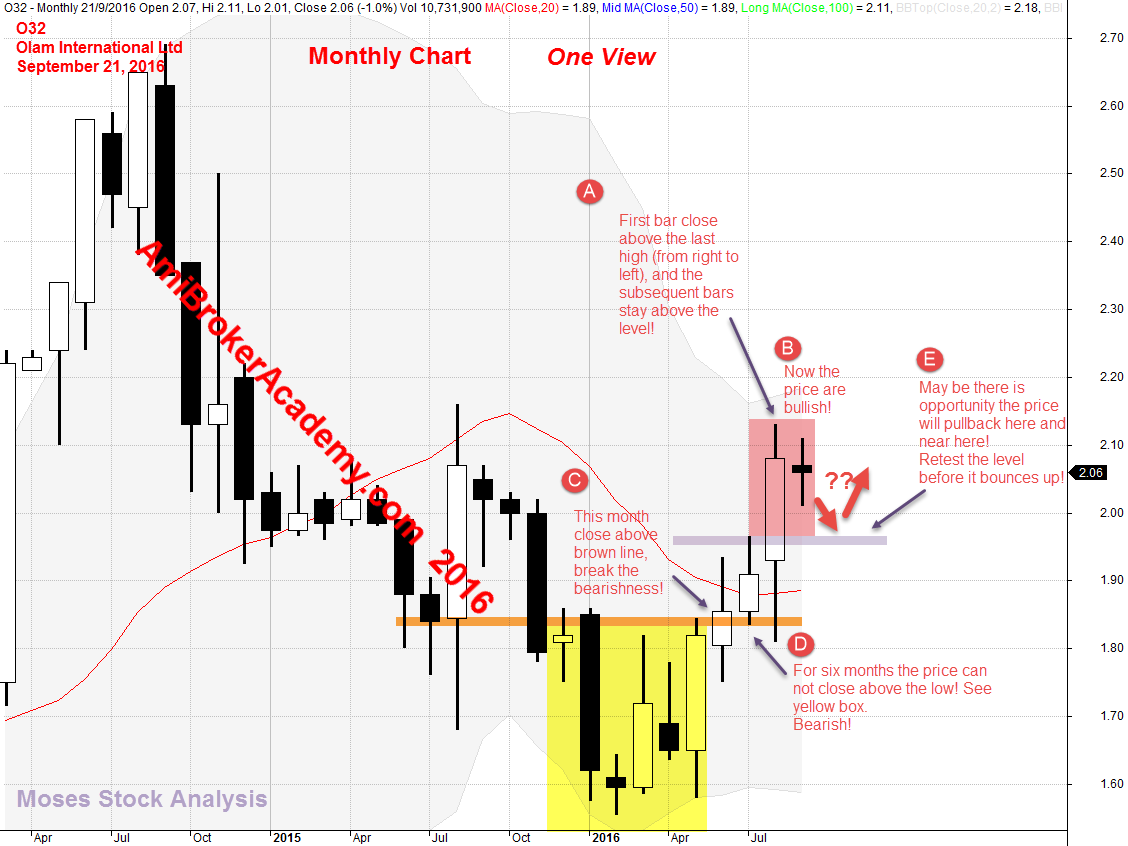
September 22, 2016 Olam International Monthly Chart
Have Fun!
Moses Singapore Stock Analysis
AmiBrokerAcademy.com
Disclaimer: All information, data and material contained, presented, or provided on amibrokeracademy.com is for educational purposes only. It is not to be construed or intended as providing trading or legal advice. Decisions you make about your trading or investment are important to you and your family, therefore should be made in consultation with a competent financial advisor or professional. We are not financial advisor and do not claim to be. Any views expressed here-in are not necessarily those held by amibrokeracademy.com. You are responsible for your trade decision and wealth being.