Welcome to AmiBrokerAcademy.com.
There are two schools of thought, random walk and chart pattern. For the past several hundreds year technical analysis rely on price and volume. However, W. D. Gann has added the time element. Technical analysis is basically looking at traders behavior, and emotions; price action. As human being are emotional, they remember the past, the behavior repeat themselves therefore the history just repeating itself.
Straits Times Index ^STI Daily Chart – November 23, 2015
All setup can fail, we see the potential bearish flag chart pattern.
Let’s guess next year, the first few months could be bearish. If the chart pattern is going to be correct. Will see!
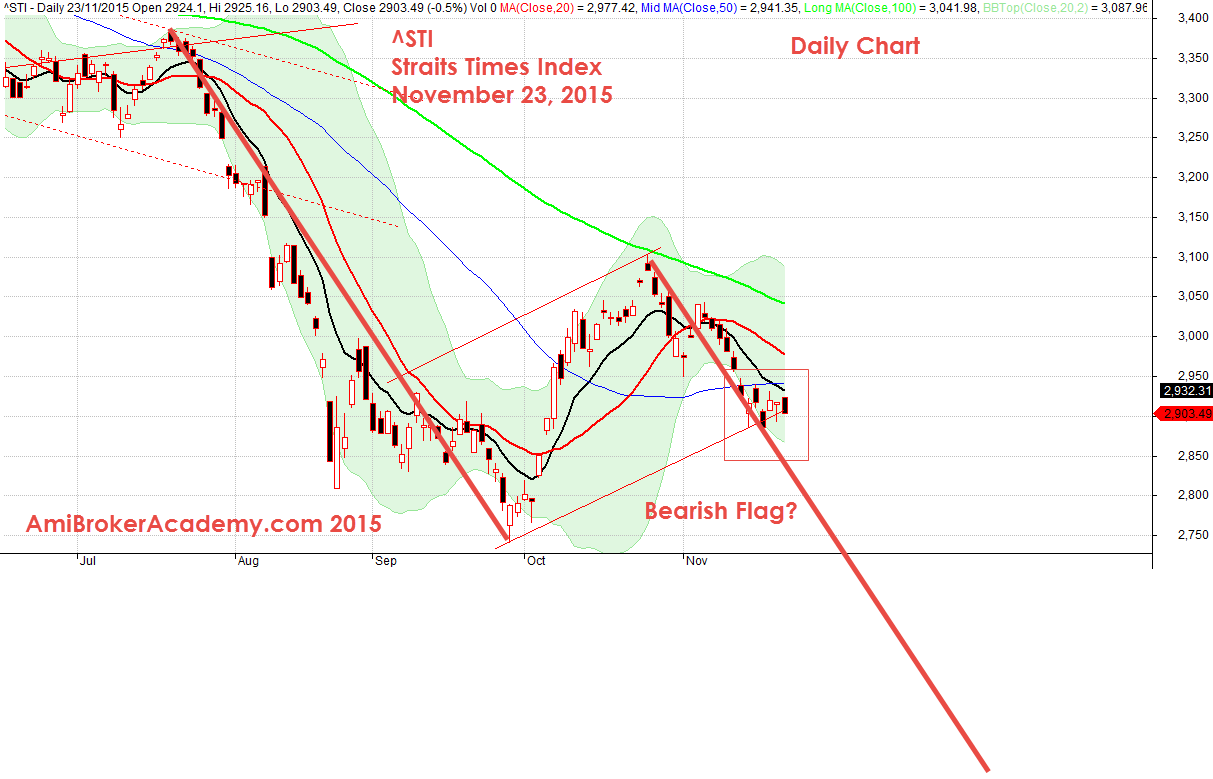
November 23, 2015 Straits Times Index Daily
You can read about other stock scan and analysis here. Hope these analysis can value add your trading strategy.
Moses STI Scan
Disclaimer: All information, data and material contained, presented, or provided on amibrokeracademy.com is for educational purposes only. It is not to be construed or intended as providing trading or legal advice. Decisions you make about your trading or investment are important to you and your family, therefore should be made in consultation with a competent financial advisor or professional. We are not financial advisor and do not claim to be. Any views expressed here-in are not necessarily those held by amibrokeracademy.com. You are responsible for your trade decision and wealth being.