18 August 2019
Welcome!
Welcome to AmiBroker Academy. Thanks for visiting the site.
Our database captures six thousand six hundred and ninety four stocks that listed in the US stock markets. With very diligent research and very good broker helps to really knows ten stocks or just five. It is really hard.
When you ignore all the rest of the six thousand six hundred and eighty four stocks. You actually just miss all the possible trade opportunities.
Truly speaking you need a short-cut to find good stocks, or from a trader view a good stock to trade. Imagine any investment you make, and you have your capital lock down. If the stock you invest, and it does not move for the next six months or more. Imagine this is very very painful.
If you can find a tool, such as MACD screener to help to identify the stocks have bull or bear bias signals. This same a lot of time. After you got the stock list like below, you can screen them again one by one to find a real trading opportunities. How good!
Moving Average Convergence Divergence, MACD
MACD was developed by Gerald Appel in the late seventies.
- MACD stands for Moving Average Convergence Divergence, the MACD line (red line or called fast line) and MACD signal line (blue line, or called slow line).
- MACD Bullish Signal Line Cross: MACD bullish signal when red line crosses above the blue line or MACD line crosses above zero line.
- MACD Bearish Signal Line Cross: MACD bearish signal when blue line crosses below red line or MACD line crosses below zero line.
MACD Scan
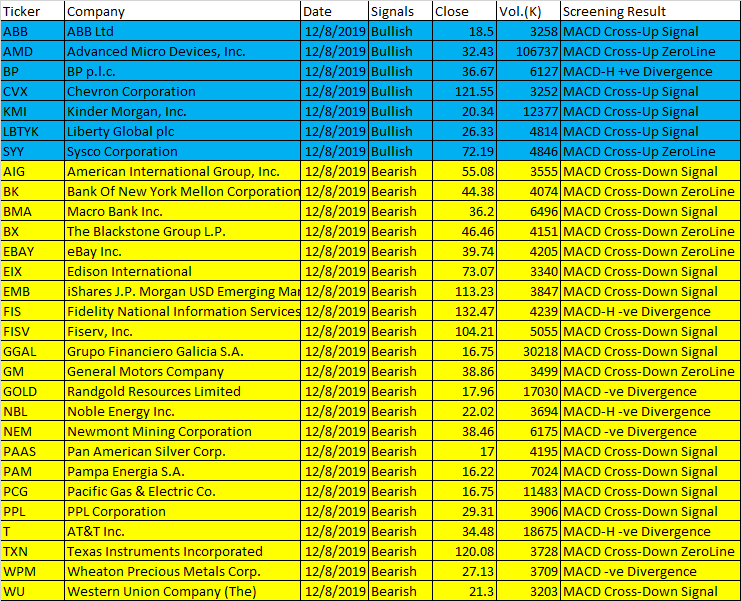
These are stocks picked for today.
12 August 2019 AmiBroker AFL Script Generated One-day U.S. Stock MACD Signals
| Ticker | Company | Date | Signals | Close | Vol.(K) | Screening Result |
| ABB | ABB Ltd | 12/8/2019 | Bullish | 18.5 | 3258 | MACD Cross-Up Signal |
| AMD | Advanced Micro Devices, Inc. | 12/8/2019 | Bullish | 32.43 | 106737 | MACD Cross-Up ZeroLine |
| BP | BP p.l.c. | 12/8/2019 | Bullish | 36.67 | 6127 | MACD-H +ve Divergence |
| CVX | Chevron Corporation | 12/8/2019 | Bullish | 121.55 | 3252 | MACD Cross-Up Signal |
| KMI | Kinder Morgan, Inc. | 12/8/2019 | Bullish | 20.34 | 12377 | MACD Cross-Up Signal |
| LBTYK | Liberty Global plc | 12/8/2019 | Bullish | 26.33 | 4814 | MACD Cross-Up Signal |
| SYY | Sysco Corporation | 12/8/2019 | Bullish | 72.19 | 4846 | MACD Cross-Up ZeroLine |
| AIG | American International Group, Inc. | 12/8/2019 | Bearish | 55.08 | 3555 | MACD Cross-Down Signal |
| BK | Bank Of New York Mellon Corporation (The) | 12/8/2019 | Bearish | 44.38 | 4074 | MACD Cross-Down ZeroLine |
| BMA | Macro Bank Inc. | 12/8/2019 | Bearish | 36.2 | 6496 | MACD Cross-Down Signal |
| BX | The Blackstone Group L.P. | 12/8/2019 | Bearish | 46.46 | 4151 | MACD Cross-Down ZeroLine |
| EBAY | eBay Inc. | 12/8/2019 | Bearish | 39.74 | 4205 | MACD Cross-Down ZeroLine |
| EIX | Edison International | 12/8/2019 | Bearish | 73.07 | 3340 | MACD Cross-Down Signal |
| EMB | iShares J.P. Morgan USD Emerging Markets Bond ETF | 12/8/2019 | Bearish | 113.23 | 3847 | MACD Cross-Down Signal |
| FIS | Fidelity National Information Services, Inc. | 12/8/2019 | Bearish | 132.47 | 4239 | MACD-H -ve Divergence |
| FISV | Fiserv, Inc. | 12/8/2019 | Bearish | 104.21 | 5055 | MACD Cross-Down Signal |
| GGAL | Grupo Financiero Galicia S.A. | 12/8/2019 | Bearish | 16.75 | 30218 | MACD Cross-Down Signal |
| GM | General Motors Company | 12/8/2019 | Bearish | 38.86 | 3499 | MACD Cross-Down ZeroLine |
| GOLD | Randgold Resources Limited | 12/8/2019 | Bearish | 17.96 | 17030 | MACD -ve Divergence |
| NBL | Noble Energy Inc. | 12/8/2019 | Bearish | 22.02 | 3694 | MACD-H -ve Divergence |
| NEM | Newmont Mining Corporation | 12/8/2019 | Bearish | 38.46 | 6175 | MACD -ve Divergence |
| PAAS | Pan American Silver Corp. | 12/8/2019 | Bearish | 17 | 4195 | MACD Cross-Down Signal |
| PAM | Pampa Energia S.A. | 12/8/2019 | Bearish | 16.22 | 7024 | MACD Cross-Down Signal |
| PCG | Pacific Gas & Electric Co. | 12/8/2019 | Bearish | 16.75 | 11483 | MACD Cross-Down Signal |
| PPL | PPL Corporation | 12/8/2019 | Bearish | 29.31 | 3906 | MACD Cross-Down Signal |
| T | AT&T Inc. | 12/8/2019 | Bearish | 34.48 | 18675 | MACD-H -ve Divergence |
| TXN | Texas Instruments Incorporated | 12/8/2019 | Bearish | 120.08 | 3728 | MACD Cross-Down ZeroLine |
| WPM | Wheaton Precious Metals Corp. | 12/8/2019 | Bearish | 27.13 | 3709 | MACD -ve Divergence |
| WU | Western Union Company (The) | 12/8/2019 | Bearish | 21.3 | 3203 | MACD Cross-Down Signal |
Moses US Stock Scan
AmiBroker Academy.com
Disclaimer:
The above result is for illustration purpose. It is not meant to be used for buy or sell decision. We do not recommend any particular stocks on our website. If particular stocks of such are mentioned, they are meant as illustration or demonstration of Amibroker as a powerful charting software or MACD scanner. Amibroker can program to scan the stocks that have MACD buy or sell signals.
These are script generated signals. Not all scan results are shown here. The MACD signal should use with price action and confirmation. Users must understand what MACD and price action are all about before using them. If necessary you should attend a course to learn more about Technical Analysis (TA) and Moving Average Convergence Divergence, MACD.
Once again, the website does not guarantee any results or investment return based on the information and instruction you have read here. It should be used as learning aids only and if you decide to trade real money, all trading decision should be your own, and you should take your own responsibility.
Besides that all setup may fail.