July 8, 2016
Supply and Demand
We discussed the price movement is due to the market supply and demand. Picture worth a thousand words. We see a ABCD sell pattern. The pattern hold till the pattern fail.
From the chart, we can see there is a demand of the stock from point C, sometimes in 2013 till the peak at 2015. Since then the stock price has been falling. The price has retest and stay above the last low for many months. So, 90 seem to be the right value, true or true?!
Many friend around me have stop changing mobile phone, as they find it too complicate to move from the existing device to the new one. Many of the apps just simply not present in the new phone. That is also true for them to update their OS, as the application are not supported under the new OS.
Apple Inc Stock Chart
A quick glance for the apple stock price since 2010, a 78 months stock chart analysis. We see a big ABCD sell pattern. From chart, the price retest the point B, can the resistance turn support. The demand start again for the stock. Will see. We do not quite see the hint for some indicator like MACD histogram; still remain the same level.
Buy and Hold
If you are those buy and hold, you may be happy or you may be frustrated. Those who bought the stock at 2010 will be happy, as you bought the stock at 30 and now is value at 90. However for those who bought at 90 in 2012 and still holding will be very frustrating. The stock price when from 90 to 50 low then bounce up to 130 and now back to 90 again; zero gain. Sigh. Even good stock like Apple, can be hurting.
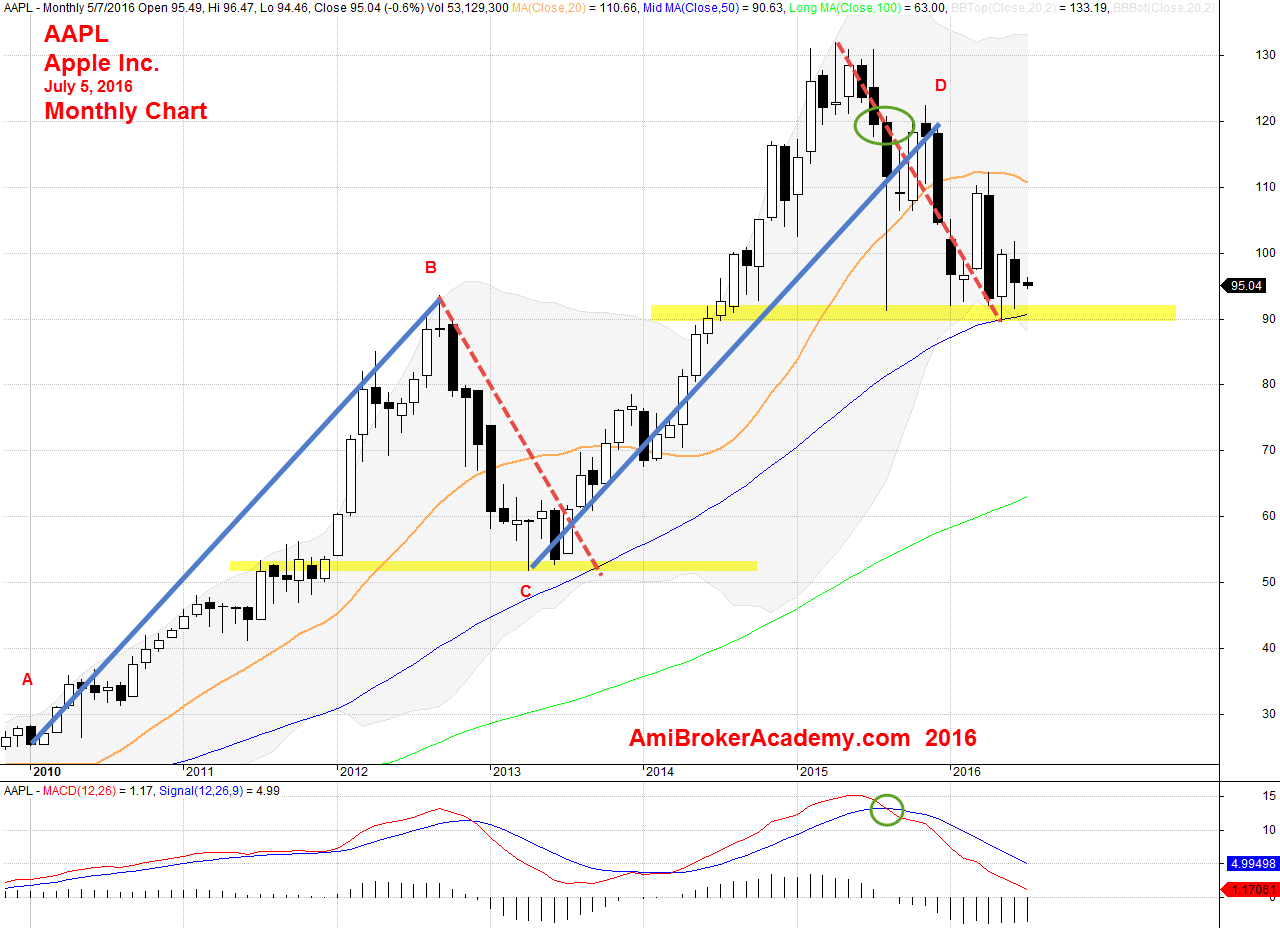
July 5, 2016 Apple Inc Monthly Chart.
If you enjoy reading the analysis here, please come back more often.
Read the past analysis for more.
Apple Inc
Thanks for visiting the site, you can find many other analysis and concepts on this site. Have fun!
Moses Stock Analysis and Scan
Disclaimer: All information, data and material contained, presented, or provided on amibrokeracademy.com is for educational purposes only. It is not to be construed or intended as providing trading or legal advice. Decisions you make about your trading or investment are important to you and your family, therefore should be made in consultation with a competent financial advisor or professional. We are not financial advisor and do not claim to be. Any views expressed here-in are not necessarily those held by amibrokeracademy.com. You are responsible for your trade decision and wealth being.
The site uses powerful charting software, AmiBroker charting software.