8 October 2016
Can MACD Signal Fail? Yes, but …
Forecasting algorithm can fail, as we are reading the unknown base on a set of rules created from the past expereince. This is just like weather forecast on typhoon or thunderstorm do not happen are common. Same goes to indicators, such as MACD signals may fail too.
Just some example on fail MACD signals, a false MACD positive signal means a bullish crossover followed by a sudden decline in a stock price. Or a false MACD negative signal can happen to fail during a bearish situation and resulting in bullish too, where there was no bullish crossover but the stock accelerated upwards.
To counter the fail MACD signals problem, the strategy is to apply filter. Example on the MACD signal crossovers to ensure that price action continues to hold up. An example of a price action filter would be to buy if the MACD line breaks above the signal line and remains above. Just like any filtering strategy, this only reduces the probability of false signals but equally this resulting you will miss the profitable trade too.
Trade reasonable and manage your risk. Do your home work and trade responsibly.
Moses’ Free US Stock MACD Scan
This site provides you free MACD scan for US near seven thousands stocks. This is just a example to demonstrate the powerful charting software, AmiBroker. The script, or program replace the manual way of checking on the chart one by one. Less than ten minutes, the script filter through the near seven thousands stock and identify the following results.
You would then pick your choice and zoom in to focus on the stock you like. Such as IBM. Read posting on, IBM | MACD Cross-Down ZeroLine .
What MACD Return
The script looks for MACD signals that has
- MACD line crosses above MACD signal – Bullish trend
- MACD line crosses above zero line – Bullish trend
- MACD Histogram +ve Divergence – Bullish trend
- MACD line crosses below MACD signal – Bearish trend
- MACD line crosses below zero line – Bearish trend
- MACD Histogram -ve Divergence – Bearish trend
- Volume traded greater 1,000,000 shares
- Price greater than 100 dollars
All in all MACD is a great indicator, it is simple and provides a leading signal on trend change.
Generally, trade on stocks that have MACD signals will provide a faster results as compare to those that do not have signal to begin with.
Note: all setup can fail. It is true for MACD setup too.
October 7, 2016 One-day US Stock MACD Scan Results
October 7, 2016 One-day MACD Scan Results
The Following are Friday October 7, 2016 One-day US Stock MACD Screening Outcome
The following are script generated signals using the Powerful AmiBroker AFL. AmiBroker is a powerful charting software. The results here are not meant to be used for buy or sell decisions. We do not vouch for their accuracy; as it depending on the author trading rules. There are meant to demonstrate the powerful Amibroker charting software functionality.
Be aware, the following signals are using MACD 8,17,9 setting instead of the default, 12,26,9.
This results took less than ten minutes to run.
NOT all scan results are shown here. To narrow the results, we filter and only those greater than 100 dollars and those more than 1,000,000 stocks changing hands.
Note:
Users must understand what MACD is all about before using the results.
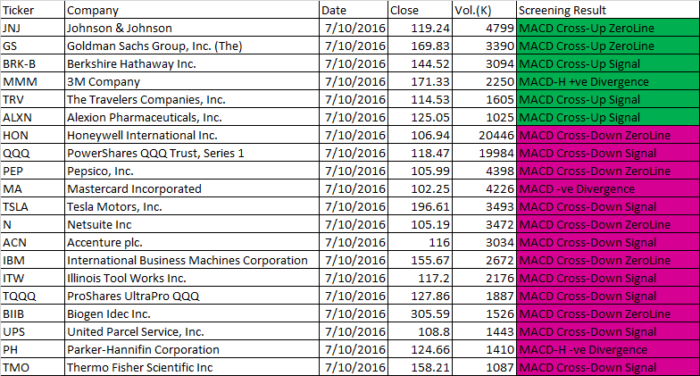
| Ticker | Company | Date | Close | Vol.(K) | Screening Result |
| JNJ | Johnson & Johnson | 7/10/2016 | 119.24 | 4799 | MACD Cross-Up ZeroLine |
| GS | Goldman Sachs Group, Inc. (The) | 7/10/2016 | 169.83 | 3390 | MACD Cross-Up ZeroLine |
| BRK-B | Berkshire Hathaway Inc. | 7/10/2016 | 144.52 | 3094 | MACD Cross-Up Signal |
| MMM | 3M Company | 7/10/2016 | 171.33 | 2250 | MACD-H +ve Divergence |
| TRV | The Travelers Companies, Inc. | 7/10/2016 | 114.53 | 1605 | MACD Cross-Up Signal |
| ALXN | Alexion Pharmaceuticals, Inc. | 7/10/2016 | 125.05 | 1025 | MACD Cross-Up Signal |
| HON | Honeywell International Inc. | 7/10/2016 | 106.94 | 20446 | MACD Cross-Down ZeroLine |
| QQQ | PowerShares QQQ Trust, Series 1 | 7/10/2016 | 118.47 | 19984 | MACD Cross-Down Signal |
| PEP | Pepsico, Inc. | 7/10/2016 | 105.99 | 4398 | MACD Cross-Down ZeroLine |
| MA | Mastercard Incorporated | 7/10/2016 | 102.25 | 4226 | MACD -ve Divergence |
| TSLA | Tesla Motors, Inc. | 7/10/2016 | 196.61 | 3493 | MACD Cross-Down Signal |
| N | Netsuite Inc | 7/10/2016 | 105.19 | 3472 | MACD Cross-Down ZeroLine |
| ACN | Accenture plc. | 7/10/2016 | 116 | 3034 | MACD Cross-Down Signal |
| IBM | International Business Machines Corporation | 7/10/2016 | 155.67 | 2672 | MACD Cross-Down ZeroLine |
| ITW | Illinois Tool Works Inc. | 7/10/2016 | 117.2 | 2176 | MACD Cross-Down Signal |
| TQQQ | ProShares UltraPro QQQ | 7/10/2016 | 127.86 | 1887 | MACD Cross-Down Signal |
| BIIB | Biogen Idec Inc. | 7/10/2016 | 305.59 | 1526 | MACD Cross-Down ZeroLine |
| UPS | United Parcel Service, Inc. | 7/10/2016 | 108.8 | 1443 | MACD Cross-Down Signal |
| PH | Parker-Hannifin Corporation | 7/10/2016 | 124.66 | 1410 | MACD-H -ve Divergence |
| TMO | Thermo Fisher Scientific Inc | 7/10/2016 | 158.21 | 1087 | MACD Cross-Down Signal |
You are reading this from Moses Desk, and have fun!
Moses US Stock MACD Scan
AmiBroker Academy.com