12 July, 2020
Welcome to AmiBroker Academy, Hong Kong, China, Shenzhen Stock MACD screener results . Thanks for visiting the site.
We use powerful AmiBroker charting software tool, ALF scripts to screen our data base that captures the stocks listed in Hong Kong, Shanghai, Shenzhen Stock Exchange.
We look for Six types of MACD Signals:
- MACD line crosses above MACD signal – Bullish trend
- MACD line crosses above zero line – Bullish trend
- MACD Histogram +ve Divergence – Bullish trend
- MACD line crosses below MACD signal – Bearish trend
- MACD line crosses below zero line – Bearish trend
- MACD Histogram -ve Divergence – Bearish trend
Selection criteria is any stock five dollars local currency or more and has minimum 3,000,000 stock changed hands.
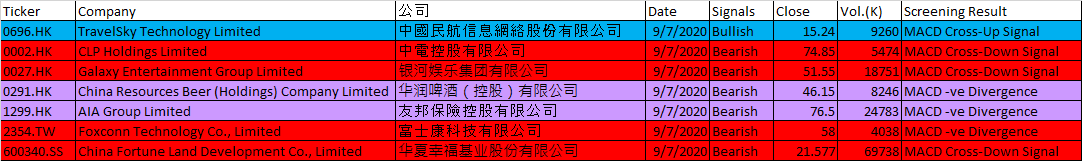
Free Moses China, Hong Kong and Taiwan Stocks MACD One-day Signals 免费 摩西 中国, 香港 及 台湾 证券 MACD 一日信号 on 9 July, 2020
Remember to trade what you see and all set up and signals can fail.
| Ticker | Company | 公司 | Date | Signals | Close | Vol.(K) | Screening Result |
| 0696.HK | TravelSky Technology Limited | 中國民航信息網絡股份有限公司 | 9/7/2020 | Bullish | 15.24 | 9260 | MACD Cross-Up Signal |
| 0002.HK | CLP Holdings Limited | 中電控股有限公司 | 9/7/2020 | Bearish | 74.85 | 5474 | MACD Cross-Down Signal |
| 0027.HK | Galaxy Entertainment Group Limited | 银河娱乐集团有限公司 | 9/7/2020 | Bearish | 51.55 | 18751 | MACD Cross-Down Signal |
| 0291.HK | China Resources Beer (Holdings) Company Limited | 华润啤酒(控股)有限公司 | 9/7/2020 | Bearish | 46.15 | 8246 | MACD -ve Divergence |
| 1299.HK | AIA Group Limited | 友邦保險控股有限公司 | 9/7/2020 | Bearish | 76.5 | 24783 | MACD -ve Divergence |
| 2354.TW | Foxconn Technology Co., Limited | 富士康科技有限公司 | 9/7/2020 | Bearish | 58 | 4038 | MACD -ve Divergence |
| 600340.SS | China Fortune Land Development Co., Limited | 华夏幸福基业股份有限公司 | 9/7/2020 | Bearish | 21.577 | 69738 | MACD Cross-Down Signal |
Moses China Stock Scan
AmiBroker Academy.com
Disclaimer:
The above result is for illustration purpose. It is not meant to be used for buy or sell decision. We do not recommend any particular stocks on our website. If particular stocks of such are mentioned, they are meant as illustration or demonstration of Amibroker as a powerful charting software or MACD scanner. Amibroker can program to scan the stocks that have MACD buy or sell signals.
These are script generated signals. Not all scan results are shown here. The MACD signal should use with price action and confirmation. Users must understand what MACD and price action are all about before using them. If necessary you should attend a course to learn more about Technical Analysis (TA) and Moving Average Convergence Divergence, MACD.
Once again, the website does not guarantee any results or investment return based on the information and instruction you have read here. It should be used as learning aids only and if you decide to trade real money, all trading decision should be your own, and you should take your own responsibility.
Besides that all setup may fail.