10 October 2016
SNE Sony Corporation Weekly Chart and MACD Indicator
MACD Histogram can provide an early signal, the divergence signal the ending of trend, or changing of trend. Find more supporting information before you trade. The following chart is just another great example on MACD.
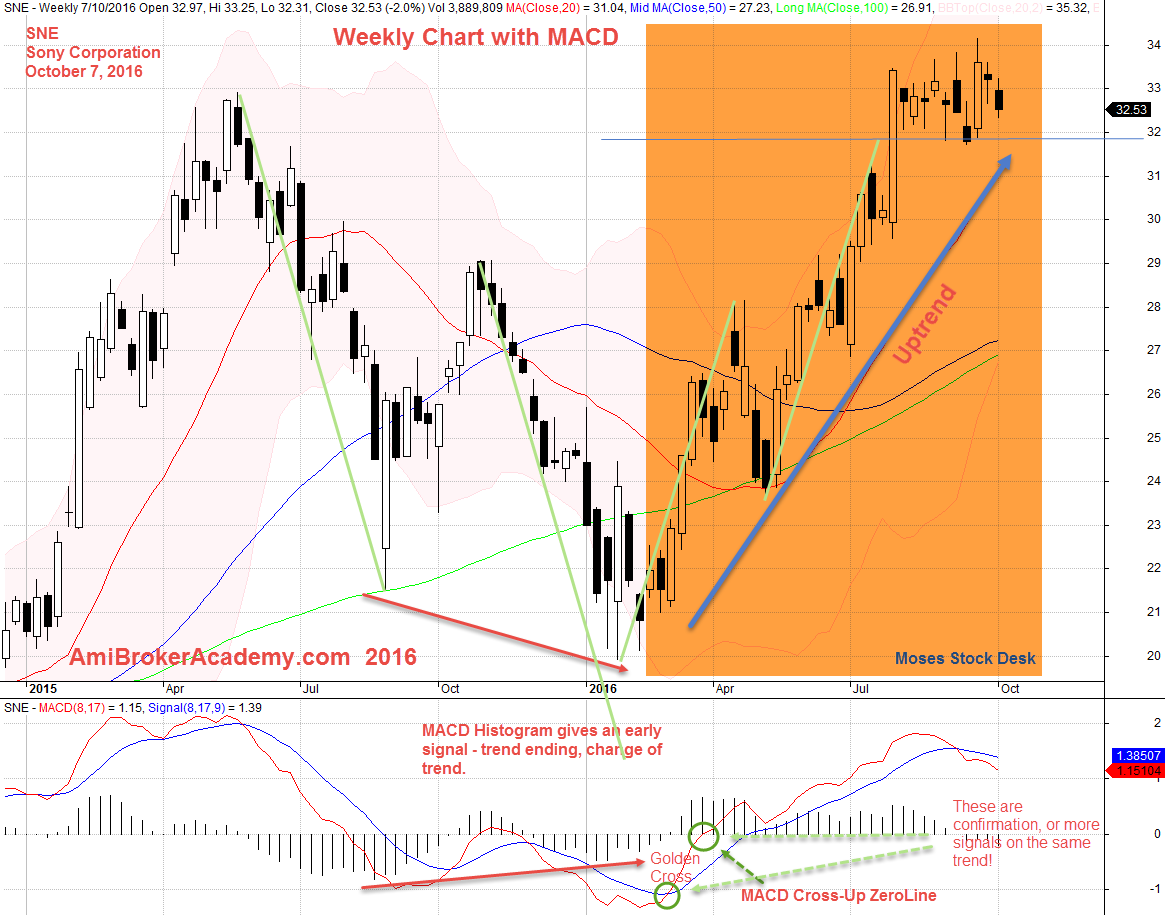
10 October 2016 SNE, Sony Corporation Weekly and MACD Indicator
Have fun!
Moses Stock Desk
AmiBrokerAcademy.com
Disclaimer: All information, data and material contained, presented, or provided on amibrokeracademy.com is for educational purposes only. It is not to be construed or intended as providing trading or legal advice. Decisions you make about your trading or investment are important to you and your family, therefore should be made in consultation with a competent financial advisor or professional. We are not financial advisor and do not claim to be. Any views expressed here-in are not necessarily those held by amibrokeracademy.com. You are responsible for your trade decision and wealth being.