Welcome to AmiBrokerAcademy.com.
This website here uses powerful charting software AmiBroker for charting and analysis.
IBM Stock Analysis
Picture worth a thousand words. From chart, price action has crossed below River and stay below River. River is slopping down; bearish bias.
Has the stock find a support? Will see.
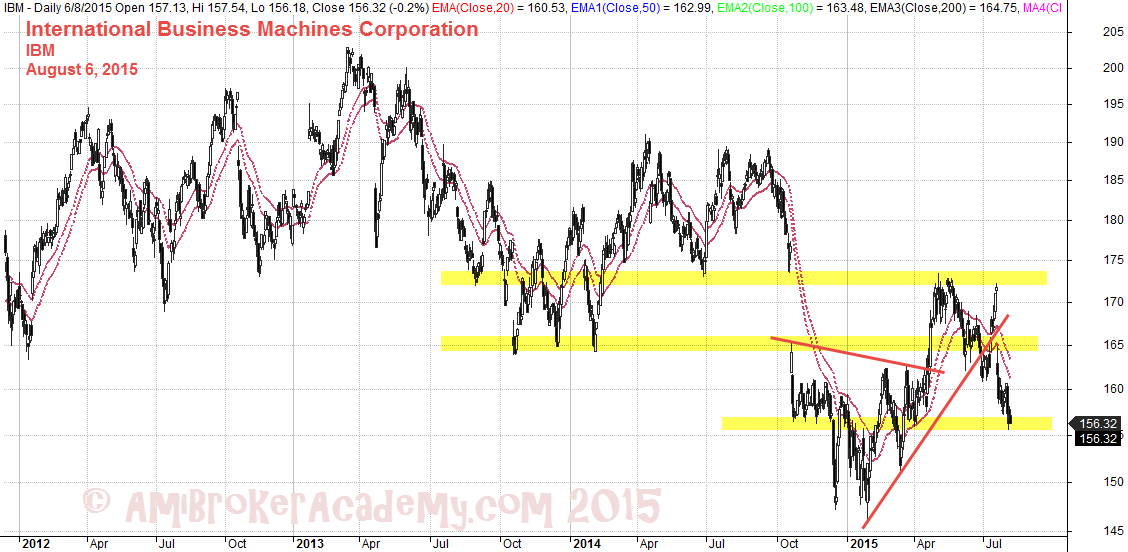
August 6, 2015 IBM Data Since 2012
Another Scenario IBM Analysis
Price action has retested the same high and fail. Price action crossed below River and resisted by River. When the price action breakout from the trendline, the support the price action may be travel further south.
Be aware also, the River is pointing down.
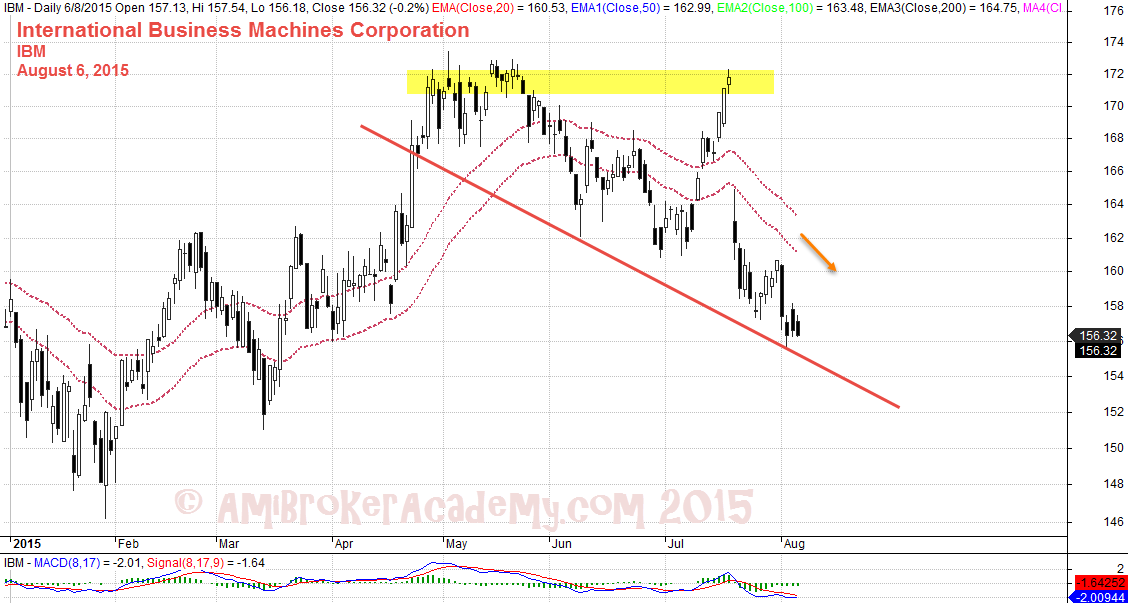
August 6, 2015 IBM
Remember all setup can fail. So wait for market to show hand. You can buy or sell depending what the market info.
Thanks for visiting the website.
Moses
DISCLAIMER
Site advice, “Stock trading is not a get rich quick scheme and it is high risk”.
Information provided here is of the nature of a general comment only and no intend to be specific for trading advice. It has prepared without regard to any particular investment objectives, financial situation or needs. Information should NOT be considered as an offer or enticement to buy, sell or trade.
You should seek advice from your broker, or licensed investment advisor, before taking any action.
The website does not guarantee any results or investment return based on the information and instruction you have read here. It should be used as learning aids.