April 6, 2018
Do Not Forget The Damage Resulted From 2008 Financial Crisis
Janet Louise Yellen, the Chair of the Board of Governors of United States Federal Reserve System from 2014–2018 ever warned that not to forget the damage caused by the last financial crisis in 2008.
What’s Global Financial Crisis
The financial crisis of 2007–2008, is known as Global Financial Crisis and the 2008 Financial Crisis. As of today it is considered to be the worst financial crisis since the Great Depression of the 1930s.
What Can We Learn From 2008 Financial Crisis?
As a policy maker what lesson can you learn, or if you are a investor what lesson you can learn, or if you are a trader what lesson you can learn, or if you are just a normal people you can learn, …
Stock Chart Analysis
China Shanghai Stock Exchange Composite Index and US NASDAQ Composite Index Correlation
Study the Shanghai Stock Index chart, the price action declined gradually, from 5500 to below 1600. Although was a lot lower over twelve months. Compare to United States, NASDAQ Composite Index the fall was sudden; the price action gaped down and deep down from near 2200 to below 1600 in a few days.
Manage your risk!
Powerful Chart Software – AmiBroker
The following chart is produced using AmiBroker charting software. It is a powerful chart software. Anything, finance ticket you could download from Yahoo! Finance you could plot them, those you are interested all in a chart, so you could analyse them.
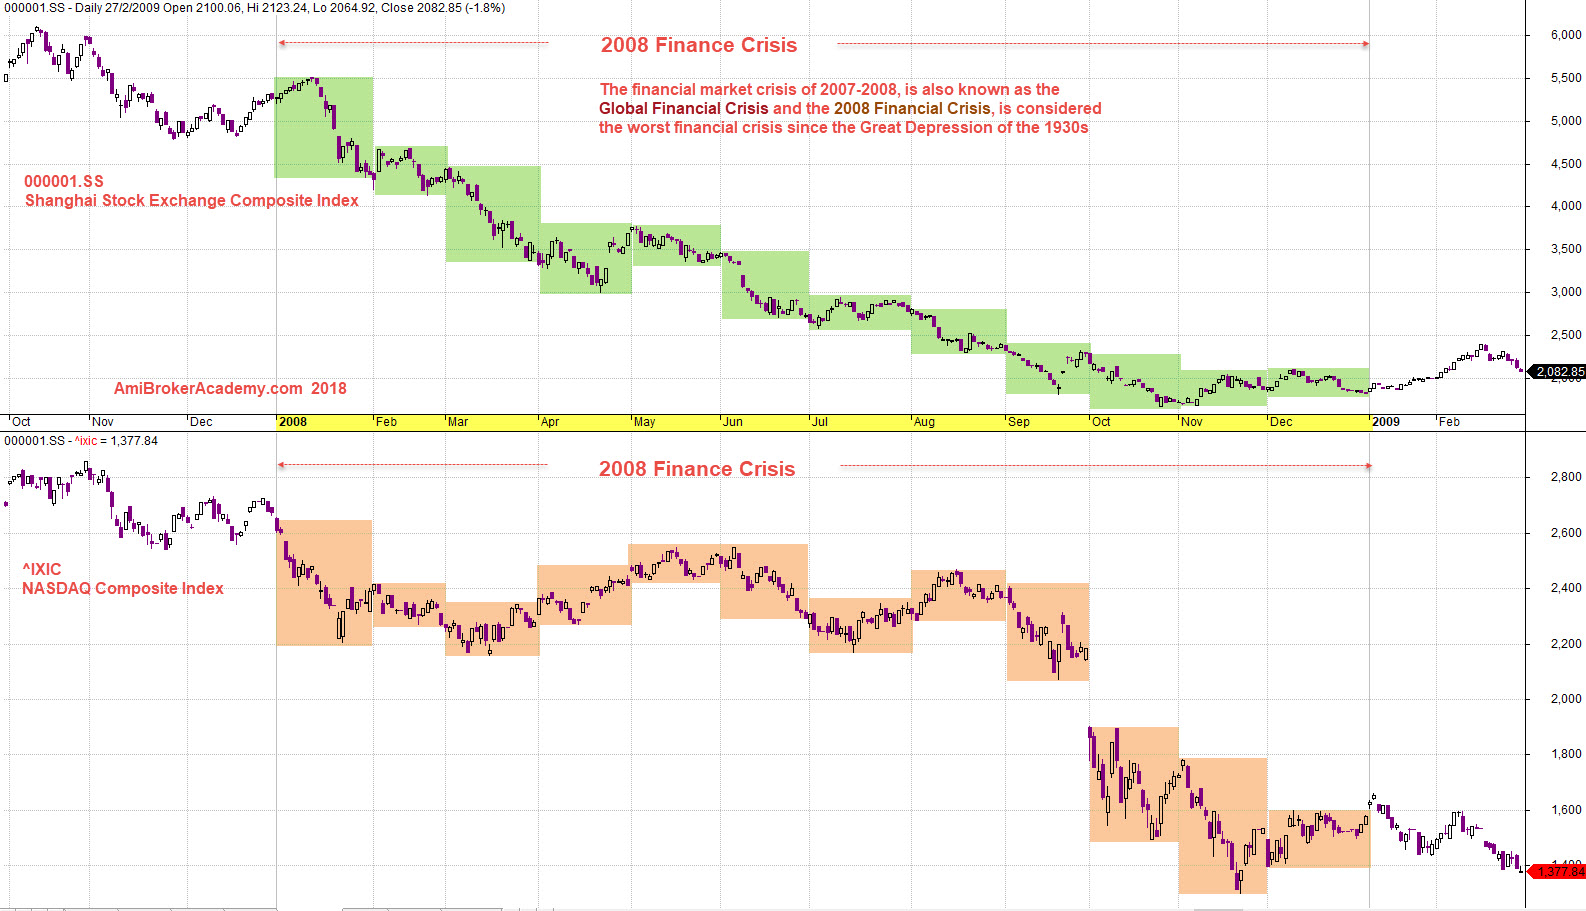
2008 Finance Crisis Shanghai Stock Exchange Composite Index and NASDAQ Composite Index Correlation
Moses Stock Chart Analysis
AmiBrokerAcademy.com
Disclaimer
The above result is for illustration purpose. It is not meant to be used for buy or sell decision. We do not recommend any particular stocks. If particular stocks of such are mentioned, they are meant as demonstration of Amibroker as a powerful charting software and MACD. Amibroker can program to scan the stocks for buy and sell signals.
These are script generated signals. Not all scan results are shown here. The MACD signal should use with price action. Users must understand what MACD and price action are all about before using them. If necessary you should attend a course to learn more on Technical Analysis (TA) and Moving Average Convergence Divergence, MACD.
Once again, the website does not guarantee any results or investment return based on the information and instruction you have read here. It should be used as learning aids only and if you decide to trade real money, all trading decision should be your own.