2 September, 2020
Welcome to AmiBroker Academy, free US Stock MACD screener results . Thanks for visiting the site.
We use powerful AmiBroker charting software tool, ALF scripts to screen our data base for our capture US stocks data.
You can read more about AmiBroker and AmiBroker AFL on AmiBroker.com.
We look for Six types of MACD Signals:
- MACD line crosses above MACD signal – Bullish trend
- MACD line crosses above zero line – Bullish trend
- MACD Histogram +ve Divergence – Bullish trend
- MACD line crosses below MACD signal – Bearish trend
- MACD line crosses below zero line – Bearish trend
- MACD Histogram -ve Divergence – Bearish trend
Selection criteria is any stock 30 cents or more and has minimum 5,000,000 stock changed hands.
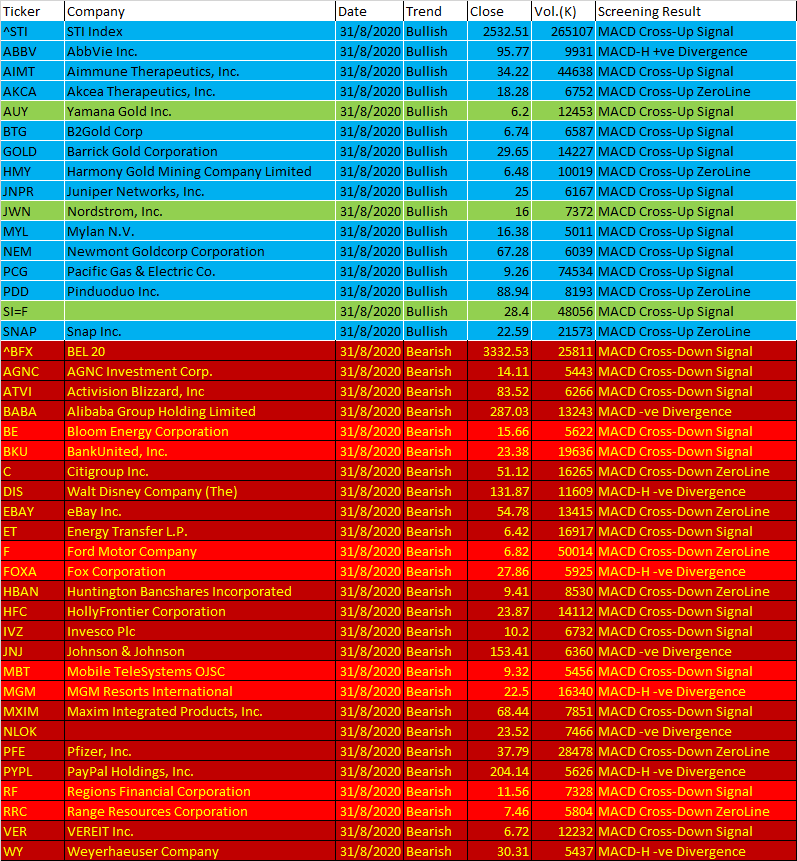
免费美股市MACD一日信号 Free US Stocks MACD One-day Signals on 31 August, 2020
Remember to trade what you see and all set up and signals can fail.
| Ticker | Company | Date | Trend | Close | Vol.(K) | Screening Result |
| ^STI | STI Index | 31/8/2020 | Bullish | 2532.51 | 265107 | MACD Cross-Up Signal |
| ABBV | AbbVie Inc. | 31/8/2020 | Bullish | 95.77 | 9931 | MACD-H +ve Divergence |
| AIMT | Aimmune Therapeutics, Inc. | 31/8/2020 | Bullish | 34.22 | 44638 | MACD Cross-Up Signal |
| AKCA | Akcea Therapeutics, Inc. | 31/8/2020 | Bullish | 18.28 | 6752 | MACD Cross-Up ZeroLine |
| AUY | Yamana Gold Inc. | 31/8/2020 | Bullish | 6.2 | 12453 | MACD Cross-Up Signal |
| BTG | B2Gold Corp | 31/8/2020 | Bullish | 6.74 | 6587 | MACD Cross-Up Signal |
| GOLD | Barrick Gold Corporation | 31/8/2020 | Bullish | 29.65 | 14227 | MACD Cross-Up Signal |
| HMY | Harmony Gold Mining Company Limited | 31/8/2020 | Bullish | 6.48 | 10019 | MACD Cross-Up ZeroLine |
| JNPR | Juniper Networks, Inc. | 31/8/2020 | Bullish | 25 | 6167 | MACD Cross-Up Signal |
| JWN | Nordstrom, Inc. | 31/8/2020 | Bullish | 16 | 7372 | MACD Cross-Up Signal |
| MYL | Mylan N.V. | 31/8/2020 | Bullish | 16.38 | 5011 | MACD Cross-Up Signal |
| NEM | Newmont Goldcorp Corporation | 31/8/2020 | Bullish | 67.28 | 6039 | MACD Cross-Up Signal |
| PCG | Pacific Gas & Electric Co. | 31/8/2020 | Bullish | 9.26 | 74534 | MACD Cross-Up Signal |
| PDD | Pinduoduo Inc. | 31/8/2020 | Bullish | 88.94 | 8193 | MACD Cross-Up ZeroLine |
| SI=F | 31/8/2020 | Bullish | 28.4 | 48056 | MACD Cross-Up Signal | |
| SNAP | Snap Inc. | 31/8/2020 | Bullish | 22.59 | 21573 | MACD Cross-Up ZeroLine |
| ^BFX | BEL 20 | 31/8/2020 | Bearish | 3332.53 | 25811 | MACD Cross-Down Signal |
| AGNC | AGNC Investment Corp. | 31/8/2020 | Bearish | 14.11 | 5443 | MACD Cross-Down Signal |
| ATVI | Activision Blizzard, Inc | 31/8/2020 | Bearish | 83.52 | 6266 | MACD Cross-Down Signal |
| BABA | Alibaba Group Holding Limited | 31/8/2020 | Bearish | 287.03 | 13243 | MACD -ve Divergence |
| BE | Bloom Energy Corporation | 31/8/2020 | Bearish | 15.66 | 5622 | MACD Cross-Down Signal |
| BKU | BankUnited, Inc. | 31/8/2020 | Bearish | 23.38 | 19636 | MACD Cross-Down Signal |
| C | Citigroup Inc. | 31/8/2020 | Bearish | 51.12 | 16265 | MACD Cross-Down ZeroLine |
| DIS | Walt Disney Company (The) | 31/8/2020 | Bearish | 131.87 | 11609 | MACD-H -ve Divergence |
| EBAY | eBay Inc. | 31/8/2020 | Bearish | 54.78 | 13415 | MACD Cross-Down ZeroLine |
| ET | Energy Transfer L.P. | 31/8/2020 | Bearish | 6.42 | 16917 | MACD Cross-Down Signal |
| F | Ford Motor Company | 31/8/2020 | Bearish | 6.82 | 50014 | MACD Cross-Down ZeroLine |
| FOXA | Fox Corporation | 31/8/2020 | Bearish | 27.86 | 5925 | MACD-H -ve Divergence |
| HBAN | Huntington Bancshares Incorporated | 31/8/2020 | Bearish | 9.41 | 8530 | MACD Cross-Down ZeroLine |
| HFC | HollyFrontier Corporation | 31/8/2020 | Bearish | 23.87 | 14112 | MACD Cross-Down Signal |
| IVZ | Invesco Plc | 31/8/2020 | Bearish | 10.2 | 6732 | MACD Cross-Down Signal |
| JNJ | Johnson & Johnson | 31/8/2020 | Bearish | 153.41 | 6360 | MACD -ve Divergence |
| MBT | Mobile TeleSystems OJSC | 31/8/2020 | Bearish | 9.32 | 5456 | MACD Cross-Down Signal |
| MGM | MGM Resorts International | 31/8/2020 | Bearish | 22.5 | 16340 | MACD-H -ve Divergence |
| MXIM | Maxim Integrated Products, Inc. | 31/8/2020 | Bearish | 68.44 | 7851 | MACD Cross-Down Signal |
| NLOK | 31/8/2020 | Bearish | 23.52 | 7466 | MACD -ve Divergence | |
| PFE | Pfizer, Inc. | 31/8/2020 | Bearish | 37.79 | 28478 | MACD Cross-Down ZeroLine |
| PYPL | PayPal Holdings, Inc. | 31/8/2020 | Bearish | 204.14 | 5626 | MACD-H -ve Divergence |
| RF | Regions Financial Corporation | 31/8/2020 | Bearish | 11.56 | 7328 | MACD Cross-Down Signal |
| RRC | Range Resources Corporation | 31/8/2020 | Bearish | 7.46 | 5804 | MACD Cross-Down ZeroLine |
| VER | VEREIT Inc. | 31/8/2020 | Bearish | 6.72 | 12232 | MACD Cross-Down Signal |
| WY | Weyerhaeuser Company | 31/8/2020 | Bearish | 30.31 | 5437 | MACD-H -ve Divergence |
Moses US Stock Scan
AmiBroker Academy.com
Disclaimer:
The above result is for illustration purpose. It is not meant to be used for buy or sell decision. We do not recommend any particular stocks on our website. If particular stocks of such are mentioned, they are meant as illustration or demonstration of Amibroker as a powerful charting software or MACD scanner. Amibroker can program to scan the stocks that have MACD buy or sell signals.
These are script generated signals. Not all scan results are shown here. The MACD signal should use with price action and confirmation. Users must understand what MACD and price action are all about before using them. If necessary you should attend a course to learn more about Technical Analysis (TA) and Moving Average Convergence Divergence, MACD.
Once again, the website does not guarantee any results or investment return based on the information and instruction you have read here. It should be used as learning aids only and if you decide to trade real money, all trading decision should be your own, and you should take your own responsibility.
Besides that all setup may fail.