9 September, 2018
Continue from the last posting, we see the price of Bitcoin keeps going higher.
US Stock Chart Analysis
BTCUSD Bitcoin In US Dollar Charting
Manage your risk!
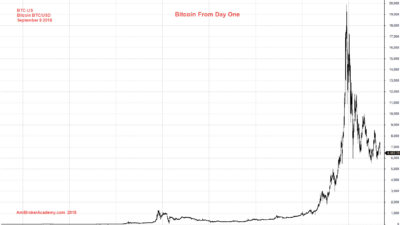
September 8, 2018 Bitcoin in US Dollars from Day One

Bitcoin from the start till 2012
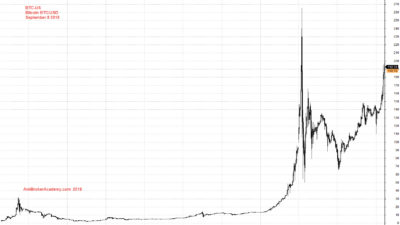
Bitcoin reach 260 in a short time

Bitcoin Less Than Three Months the Price Cross one thousand dollars
Price jump to above 5000 dollars. See chart.
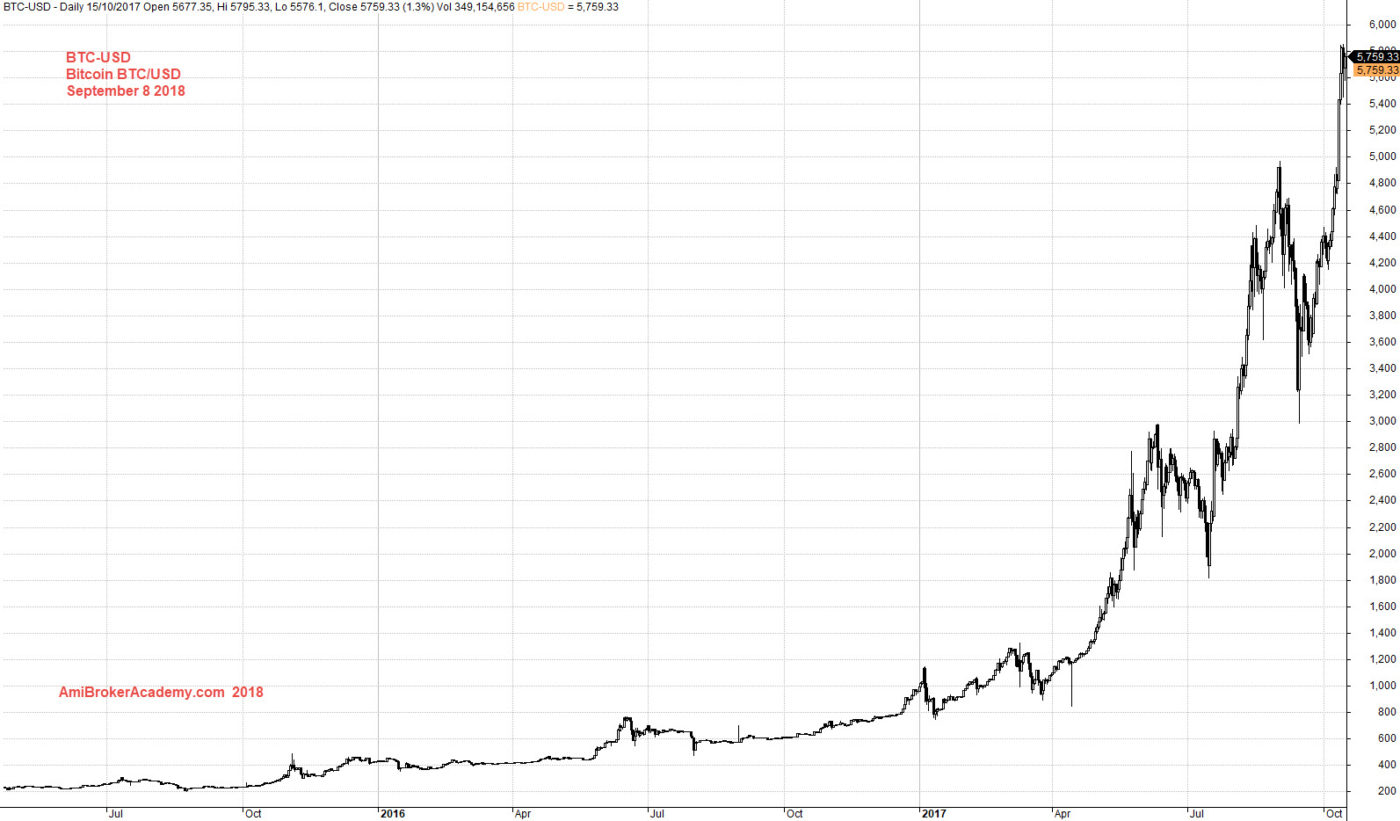
Bitcoin Price Jump Again to above 5000
Bitcoin rally in last year October to December to reach 20,000 dollars. See chart.
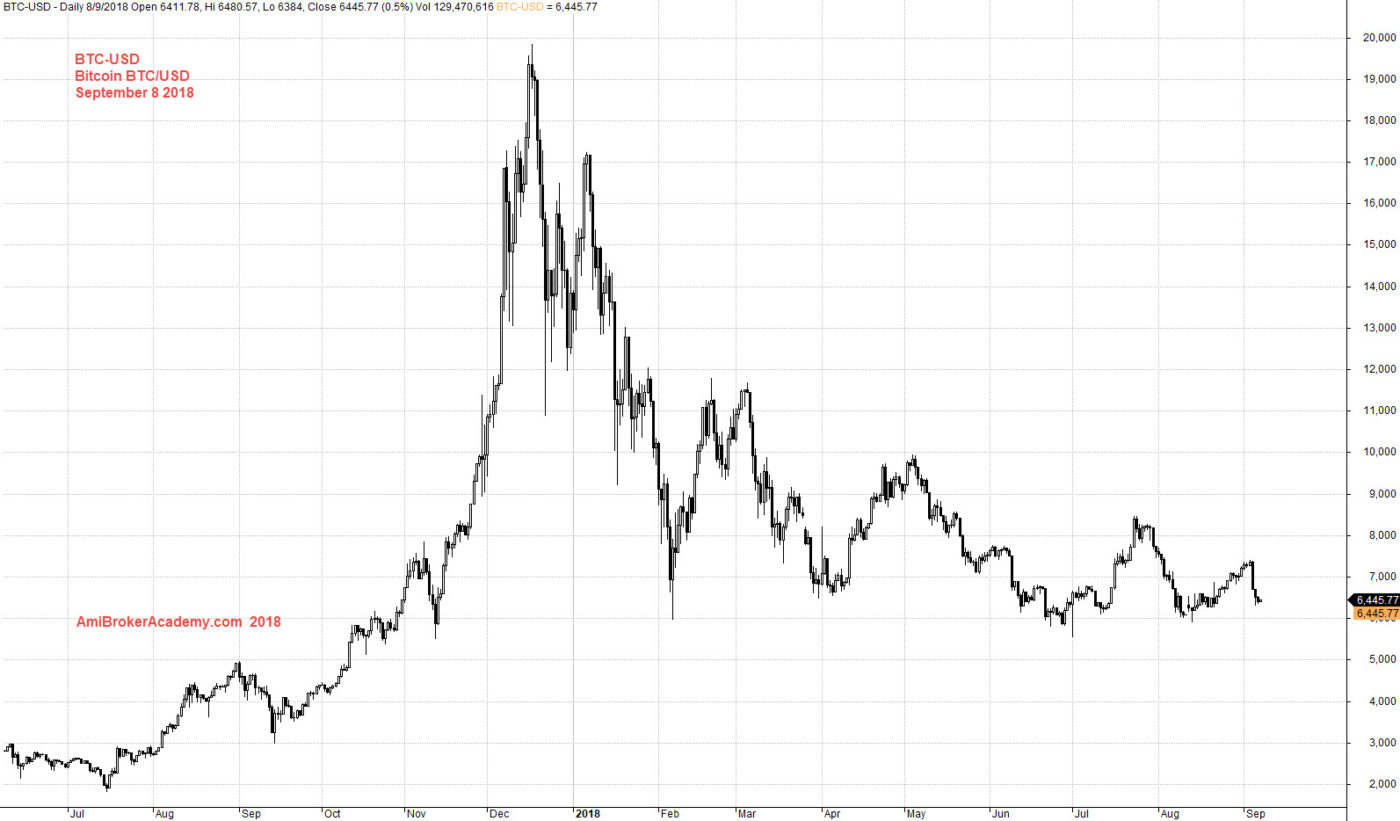
Bitcoin reach the peak at 20000
Moses US Stock Chart Analysis
AmiBrokerAcademy.com
Disclaimer
The above result is for illustration purpose. It is not meant to be used for buy or sell decision. We do not recommend any particular stocks. If particular stocks of such are mentioned, they are meant as demonstration of Amibroker as a powerful charting software and MACD. Amibroker can program to scan the stocks for buy and sell signals.
These are script generated signals. Not all scan results are shown here. The MACD signal should use with price action. Users must understand what MACD and price action are all about before using them. If necessary you should attend a course to learn more on Technical Analysis (TA) and Moving Average Convergence Divergence, MACD.
Once again, the website does not guarantee any results or investment return based on the information and instruction you have read here. It should be used as learning aids only and if you decide to trade real money, all trading decision should be your own.