November 22, 2017
600019.SS and HM Gartley ABCD Pattern
See chart for more, the weekly Baoshan Steel chart. If you try the ABCD sell pattern, you are okay. Do you get some trade idea?
The following chart is plot using AmiBroker charting software. AmiBroker is a powerful charting software.
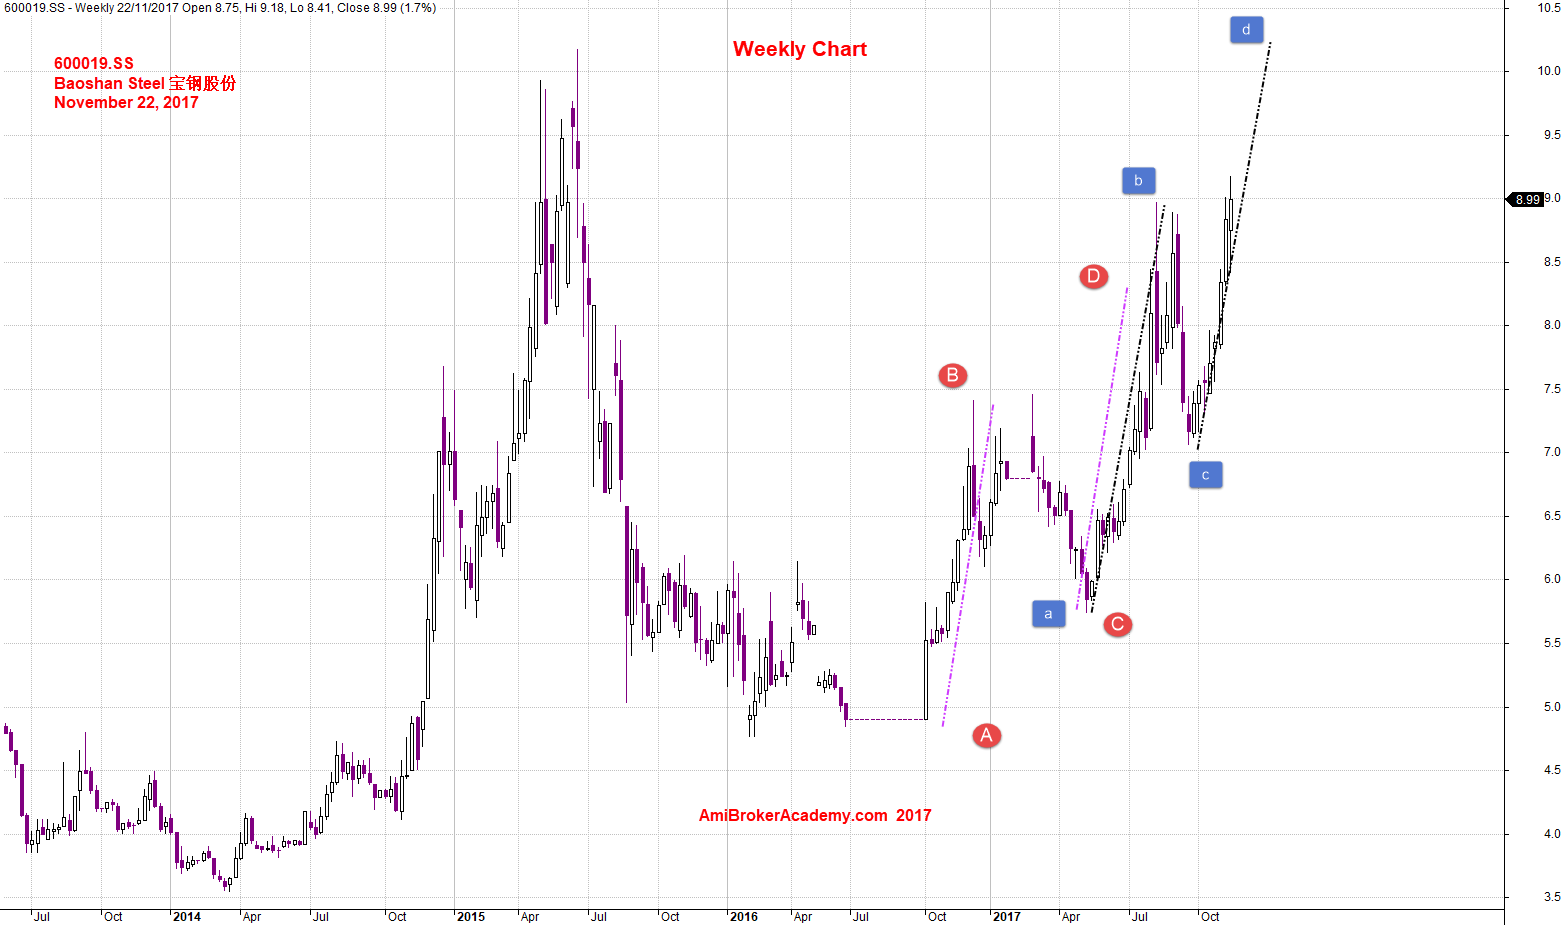
November 22, 2017 Baoshan Steel Weekly and ABCD Pattern
宝钢股份600019.SS Baoshan Steel and Channel
See chart for more. If you use Elliott Wave Theory, you can also see the wave development.
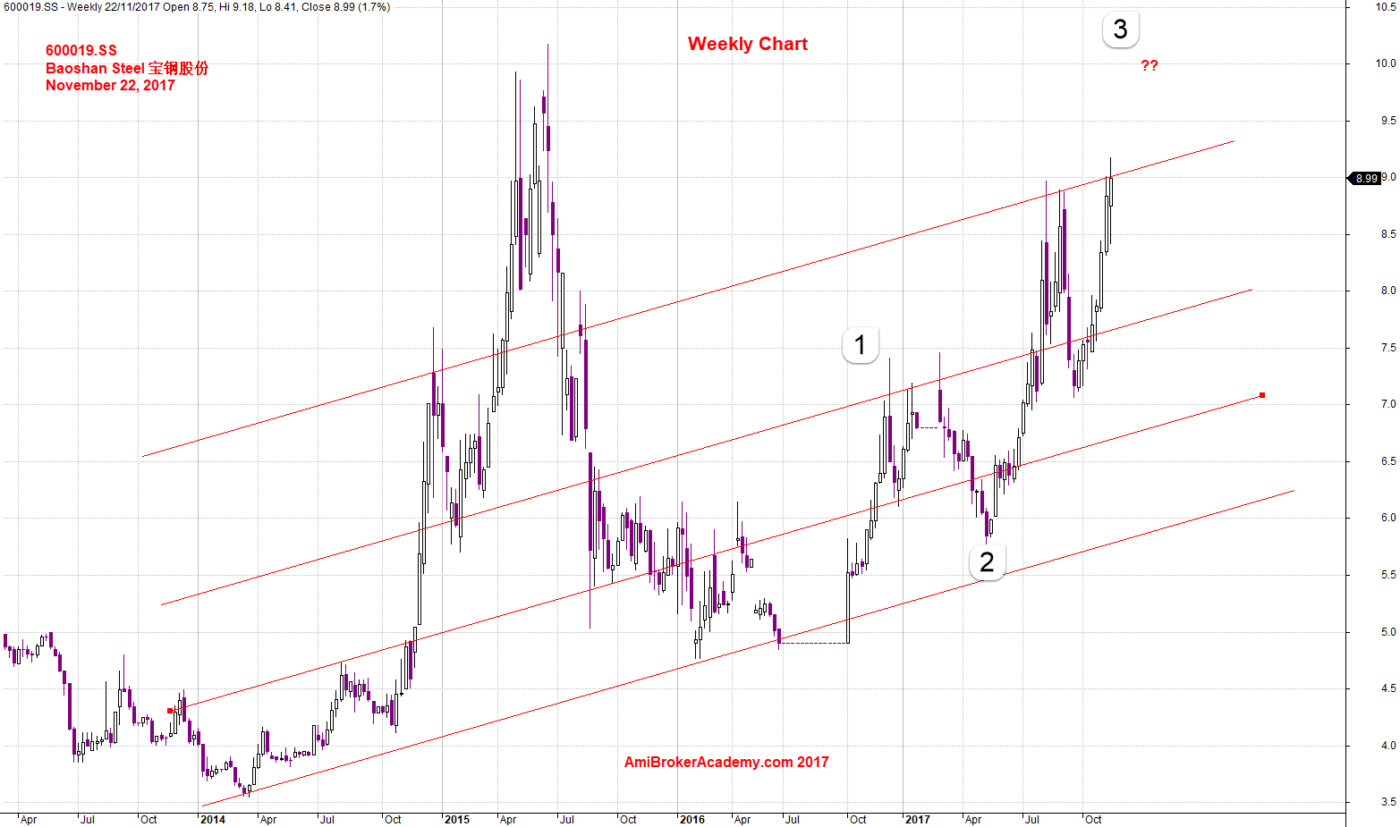
November 22, 2017 Baoshan Steel Weekly Chart and Channel
宝钢股份BaoShan Steel 600019.SS and MACD Signals
See chart for more.
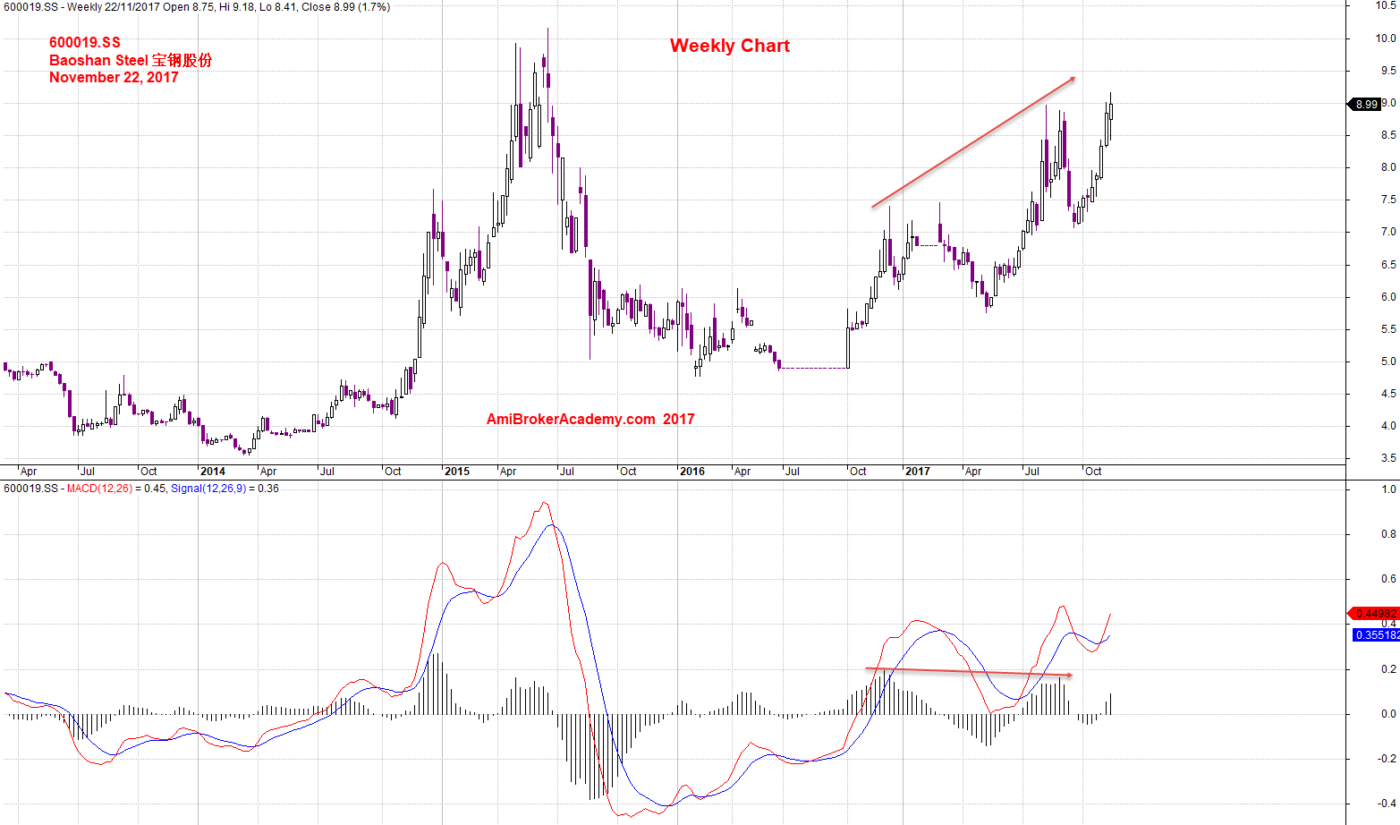
November 22, 2017 Baoshan Steel Weekly 宝钢股份 and MACD Divergence
BaoShan Steel 600019.SS and Support Resistance
Support Resistance, 10 the round number stop the price from reaching higher. See chart.
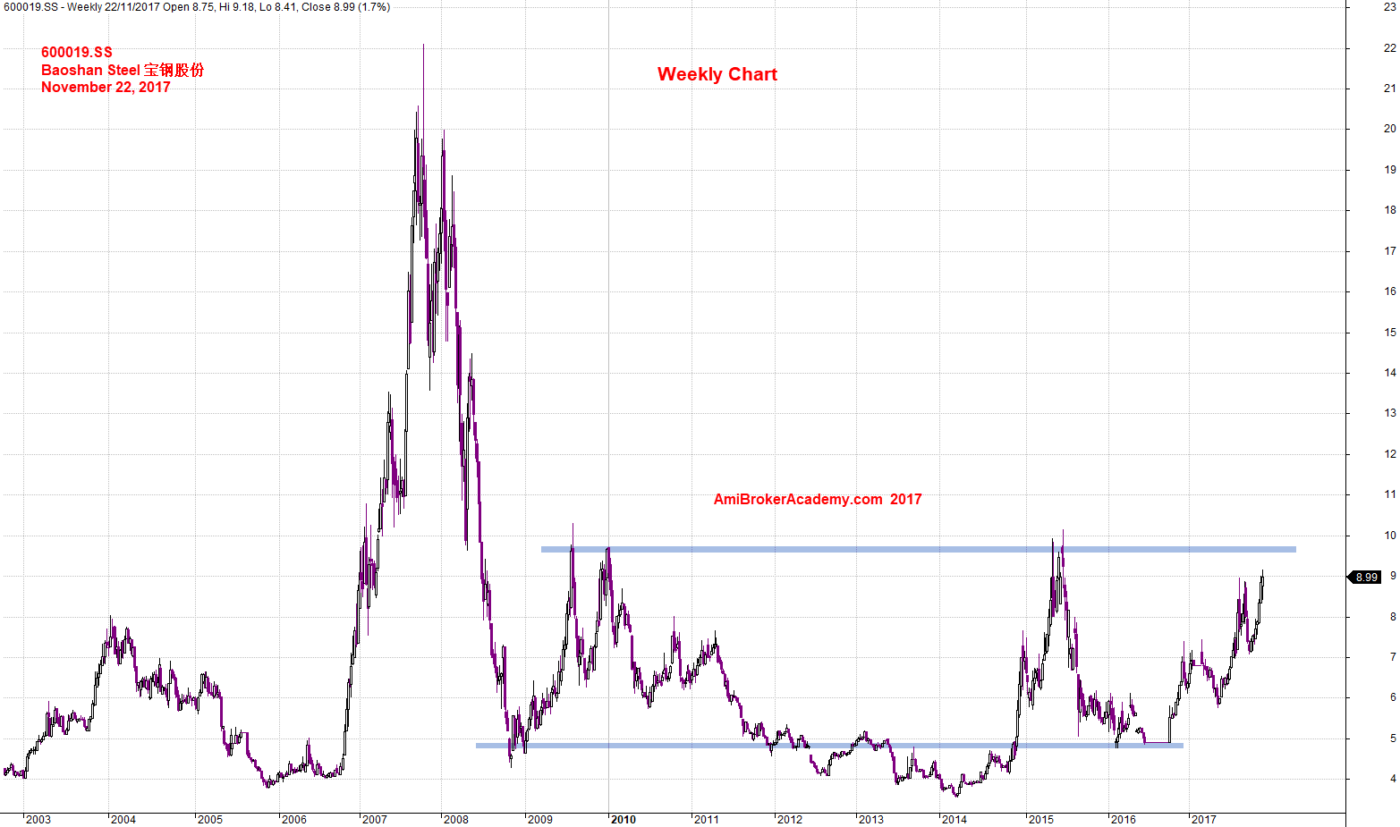
November 22, 2017 Baoshan Steel Weekly and Support Resistance
Moses
AmiBrokerAcademy.com
Disclaimer
The above result is for illustration purpose. It is not meant to be used for buy or sell decision. We do not recommend any particular stocks. If particular stocks of such are mentioned, they are meant as demonstration of Amibroker as a powerful charting software and MACD. Amibroker can program to scan the stocks for buy and sell signals.
These are script generated signals. Not all scan results are shown here. The MACD signal should use with price action. Users must understand what MACD and price action are all about before using them. If necessary you should attend a course to learn more on Technical Analysis (TA) and Moving Average Convergence Divergence, MACD.
Once again, the website does not guarantee any results or investment return based on the information and instruction you have read here. It should be used as learning aids only and if you decide to trade real money, all trading decision should be your own.