February 25, 2017
Oscillator Moving Average Convergence Divergence
MACD is a popular trend following momentum indicator that shows the relationship of two moving averages of prices action; the MACD line and signal line.
Four MACD Signals:
- Crossovers – Sell Strategy, MACD crosses below the signal line. Buy Strategy, MACD rallies above the signal line. It is advisable to wait for confirmation to reduce possible whipsaw.
- Divergence – The security price action diverges from the MACD. It signals the end of the current trend.
- Cross Zero Line – MACD moves above or below zero line. Upward trend: Cross above zero line, short MA above long MA. Downward trend: Cross below zero line, short MA below long MA.
- Dramatic rise or fall – MACD rises or decline dramatically – when the shorter moving average pulls away from the longer-term moving average – Oversold or Overbought.
Free US Stocks MACD Scan for Stocks closed greater than thirty 51 dollars to 250 dollars on Friday February 24, 2017
- Stock volume traded greater 3,000K
- MACD line crosses above MACD signal – Bullish trend
- MACD line crosses above zero line – Bullish trend
- MACD Histogram +ve Divergence – Bullish trend
- MACD line crosses below MACD signal – Bearish trend
- MACD line crosses below zero line – Bearish trend
- MACD Histogram -ve Divergence – Bearish trend
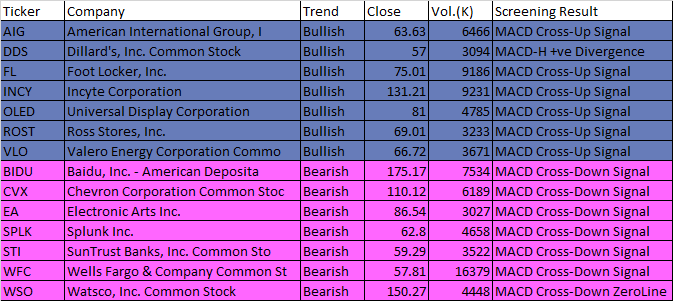
February 24, 2017 US Stock MACD Scan
| Ticker | Company | Date | Trend | Close | Vol.(K) | Screening Result |
| AIG | American International Group, I | 24/2/2017 | Bullish | 63.63 | 6466 | MACD Cross-Up Signal |
| DDS | Dillard’s, Inc. Common Stock | 24/2/2017 | Bullish | 57 | 3094 | MACD-H +ve Divergence |
| FL | Foot Locker, Inc. | 24/2/2017 | Bullish | 75.01 | 9186 | MACD Cross-Up Signal |
| INCY | Incyte Corporation | 24/2/2017 | Bullish | 131.21 | 9231 | MACD Cross-Up Signal |
| OLED | Universal Display Corporation | 24/2/2017 | Bullish | 81 | 4785 | MACD Cross-Up Signal |
| ROST | Ross Stores, Inc. | 24/2/2017 | Bullish | 69.01 | 3233 | MACD Cross-Up Signal |
| VLO | Valero Energy Corporation Commo | 24/2/2017 | Bullish | 66.72 | 3671 | MACD Cross-Up Signal |
| BIDU | Baidu, Inc. – American Deposita | 24/2/2017 | Bearish | 175.17 | 7534 | MACD Cross-Down Signal |
| CVX | Chevron Corporation Common Stoc | 24/2/2017 | Bearish | 110.12 | 6189 | MACD Cross-Down Signal |
| EA | Electronic Arts Inc. | 24/2/2017 | Bearish | 86.54 | 3027 | MACD Cross-Down Signal |
| SPLK | Splunk Inc. | 24/2/2017 | Bearish | 62.8 | 4658 | MACD Cross-Down Signal |
| STI | SunTrust Banks, Inc. Common Sto | 24/2/2017 | Bearish | 59.29 | 3522 | MACD Cross-Down Signal |
| WFC | Wells Fargo & Company Common St | 24/2/2017 | Bearish | 57.81 | 16379 | MACD Cross-Down Signal |
| WSO | Watsco, Inc. Common Stock | 24/2/2017 | Bearish | 150.27 | 4448 | MACD Cross-Down ZeroLine |
February 24 US Stock NASDAQ Composite Index Chart
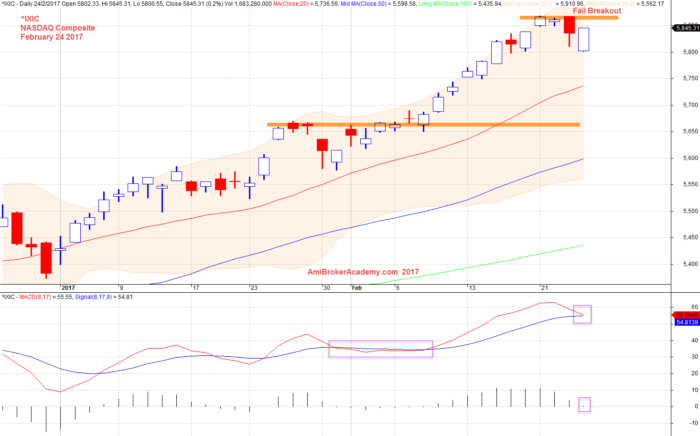
February 24, 2017 NASDAQ Composite Index
Thanks for visiting the site, AmiBrokerAcademy.com.
Moses
AmiBrokerAcademy.com
DISCLAIMER
Stock trading is not a get rich quick scheme and it is high risk.
Information provided here is of the nature of a general comment only and no intend to be specific for trading advice. It has prepared without regard to any particular investment objectives, financial situation or needs. Information should NOT be considered as an offer or enticement to buy, sell or trade.
You should seek advice from your broker, or licensed investment advisor, before taking any action.
Once again, the website does not guarantee any results or investment return based on the information and instruction you have read here. It should be used as learning aids.
Trading is personal. You are responsible for your own trading decision.
The comment is the author personal experience. There is no intent for your believe and follow.