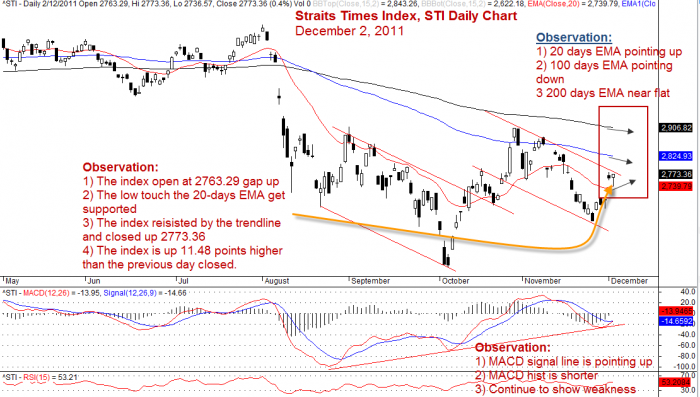
Daily STI scan, Singapore stocks market benchmark, Straits Times Index scan, December 2, 2011, after the weak closed below the open STI gaped up at the market open at 2763.29 points. However, with the pressure from traders and investors taking profit the index was drove lower to 2736.57 and touched the 20 days EMA. The index was supported by the 20 EMA and the market ended in 2773.36, the high of the day too. The STI index was 11.48 points higher than the previous day closed.
See the observation and comment on the STI Daily Chart.
 STI Weekly View
Where will the ST Index move next week? From the technical analysis view point, the STI is supported at the critical level. From TA, when the level is broken, means the level fail to support the index the index could go even lower. When it get supported than the index will remain floating or bouncing above the support.
There is a morning star candlestick pattern at this critical level. But as many would say from the experience most the time the candlestick pattern would not work. This is true for candlestick pattern without a present of any critical support or resistance. Now having said all these, these are TA, it is a chart analysis, remember it just provide a probability where the market might go. You and many of the traders and investors are the one that move the market.
See the STI Weekly Chart for more comment and Support and Resistance.
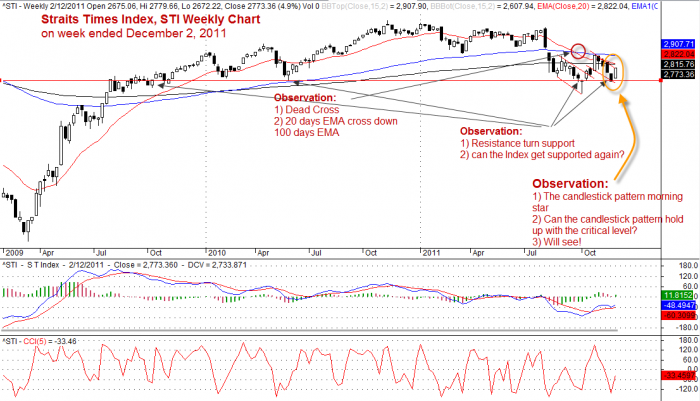
There is also a Dead Cross of 20 days EMA crossed down 100 days EMA. 20 EMA touches the 200 EMA. So, will the second Dead Cross happen? If the morning start candlestick pattern does not hold. Anyway, trade with caution, as a trader or investor you take responsibility of your trading decision. Have a jolly Christmas!
Disclaimer
The information presented here is for illustration purpose. It is not meant to be used for buy or sell decision. It is solely the author analysis and opinion about the market. We do not recommend you trade base on what you read here. If particular strategy, technique, trigger are mentioned, they are meant as demonstration how it being used by some trader and investor.
Trading in any financial instrument such as stocks, options, indices, currencies and future are personal and involve risk and should not undertake without learning from professional traders. Readers may carry out trading based on what they learnt, but all risks and potential financial losses are the readers own responsibility.
Once again, the website does not guarantee any results or investment return based on the information and instruction you have read here.
Leave a Reply
You must be logged in to post a comment.