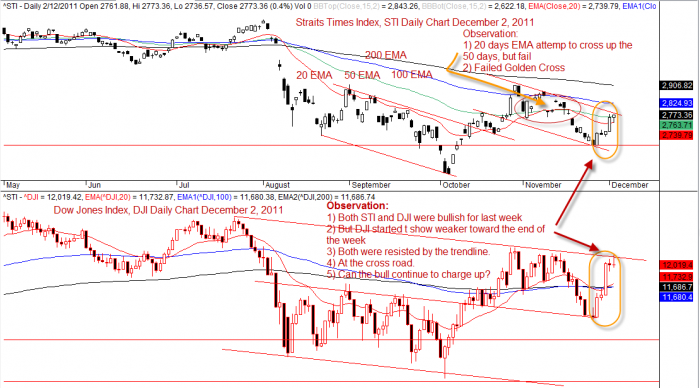
Continue from the last posting, we were looked at STI from a weekly perspective. We saw a morning start candlestick pattern. Sat on a critical level. So, if it hold true, the index should continue to be bullish. However when you examine it from a daily timeframe, we realize the index get resisted by the trendline we drew much earlier. Last week was a bullish week, after STI has bearish for four weeks.
Cross check with Dow Jones Index, DJI, we also find a similar pattern that Dow Jones Index was also bullish for the week, except it get indecisive towards the end of the week, Friday. DJI is now also resisted by a parallel trendline that we drew earlier.
Now, we see two different views from two different timeframes; daily and weekly. One says up, the other says down. Which one is correct? The answer is both are correct. At the lower timeframe, the index could be get resisted for a few days, but finally for the week it can still closed bullish.
The market will continue to be volatile. Traders and investors will continue to buy and sell. Trade with caution.
See STI daily chart for the illustration and the DJI correlation.
See the following link for the STI Weekly analysis.
Disclaimer
The information presented here is for illustration purpose. It is not meant to be used for buy or sell decision. It is solely the author analysis and opinion about the market. We do not recommend you trade base on what you read here. If particular strategy, technique, trigger are mentioned, they are meant as demonstration how it being used by some trader and investor.
Trading in any financial instrument such as stocks, options, indices, currencies and future are personal and involve risk and should not undertake without learning from professional traders. Readers may carry out trading based on what they learnt, but all risks and potential financial losses are the readers own responsibility.