September 30, 2016
September 30, 2016 Straits Times Index Charting
Singapore stocks benchmark, Straits Times Index, ^STI has been moving sideways. Index has been near moving average, 20 MA. Is it time to buy? Chart worth a thousand words. See chart for more. A close up look, you will find the index is still not out of the woods, bearishness.
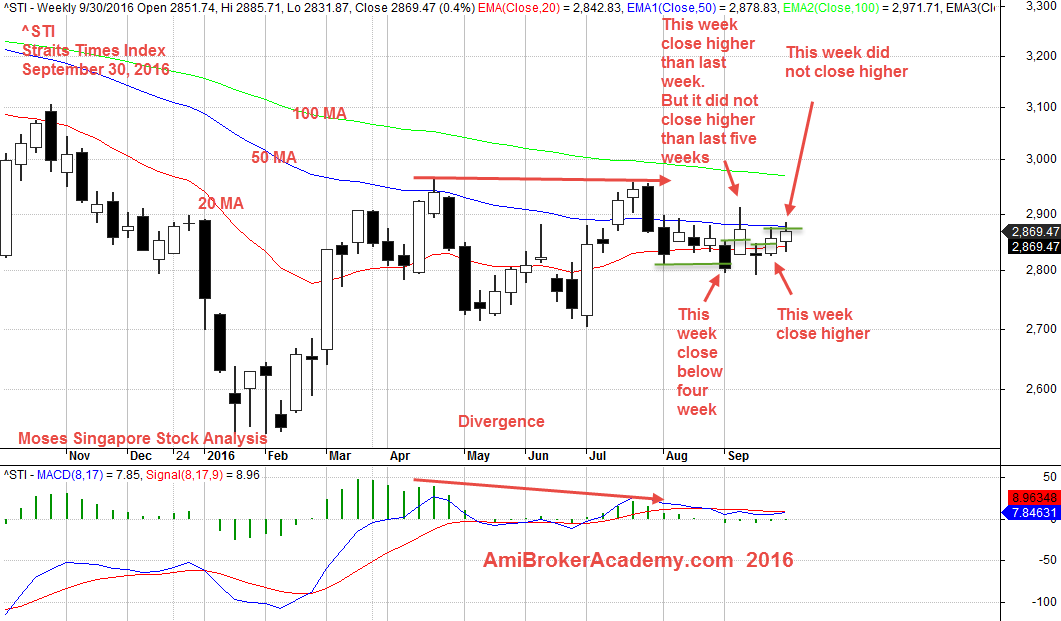
September 30, 2016 Straits Times Index, ^STI Weekly Chart
Have fun!
Moses Singapore Stock Analysis
AmiBrokerAcademy.com
Disclaimer: All information, data and material contained, presented, or provided on amibrokeracademy.com is for educational purposes only. It is not to be construed or intended as providing trading or legal advice. Decisions you make about your trading or investment are important to you and your family, therefore should be made in consultation with a competent financial advisor or professional. We are not financial advisor and do not claim to be. Any views expressed here-in are not necessarily those held by amibrokeracademy.com. You are responsible for your trade decision and wealth being.