March 12, 2016
Welcome to AmiBrokerAcademy.com Moses Stock Analysis.
To Complete Double Bottom
Standard and Poor’s 500, S&P 500
In our last analysis, we saw Dow Jones Industrial Average is in the mode of changing direction; double bottom. See previous posting for details. If you zoom out, said twelve months data at S&P 500 chart, it has a bigger double bottom in the making. Picture worth a thousand words. See chart for more.
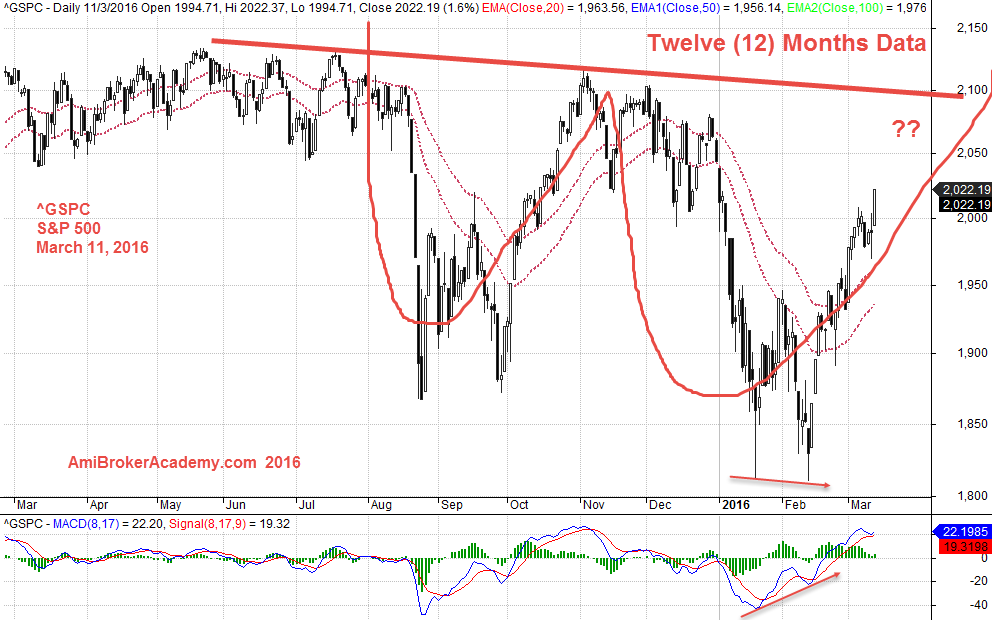
March 11, 2016 Standard and Poor’s 500 Twelve Months Data
Double Bottoms, S&P 500
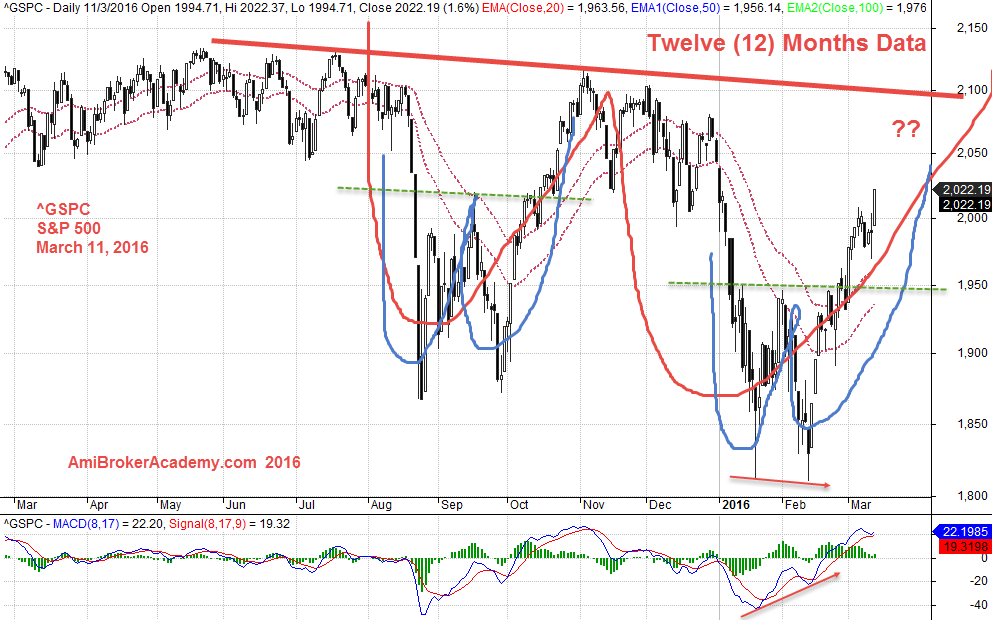
March 11, 2016 S&P Twelve Months Data and Double Bottom
MACD is showing weakness; potentially the price may be changing direction.
Moses US Stocks Analysis and Scan
Disclaimer: All information, data and material contained, presented, or provided on amibrokeracademy.com is for educational purposes only. It is not to be construed or intended as providing trading or legal advice. Decisions you make about your trading or investment are important to you and your family, therefore should be made in consultation with a competent financial advisor or professional. We are not financial advisor and do not claim to be. Any views expressed here-in are not necessarily those held by amibrokeracademy.com. You are responsible for your trade decision and wealth being.