July 26, 2017
China Shanghai Stock Exchange Composite Index Analysis
Bull, or bear. Picture worth a thousand words.
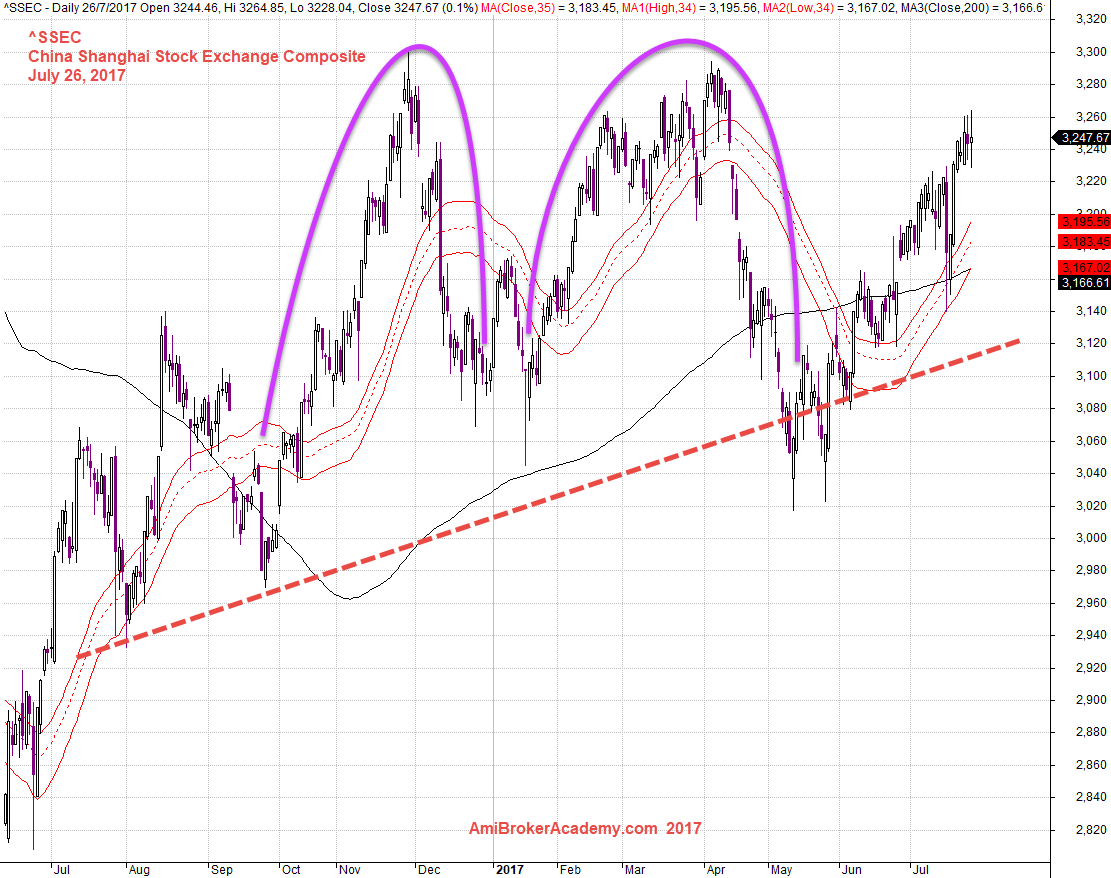
^SSEC China Shanghai Stock Exchange Composite Index and 34 MA Band
See chart for more, picture worth a thousand words.
SSEC China Index is bouncing above MA, the 34 MA band. However the index has been crossing up and down. I am not sure the index will stay above the MA, the 34 MA.
But 200 MA is slopping up, so still bull.
You can easily identify the tops, two tops. so double top. But it may be ended up head and shoulder. See chart the right shoulder is in progress.
The red trendline gives you the clue the trend is still up.
So, this index not clear cut, up or down. It has been in a big zigzag movement.
July 26, 2017 China SSEC and 34 MA Band
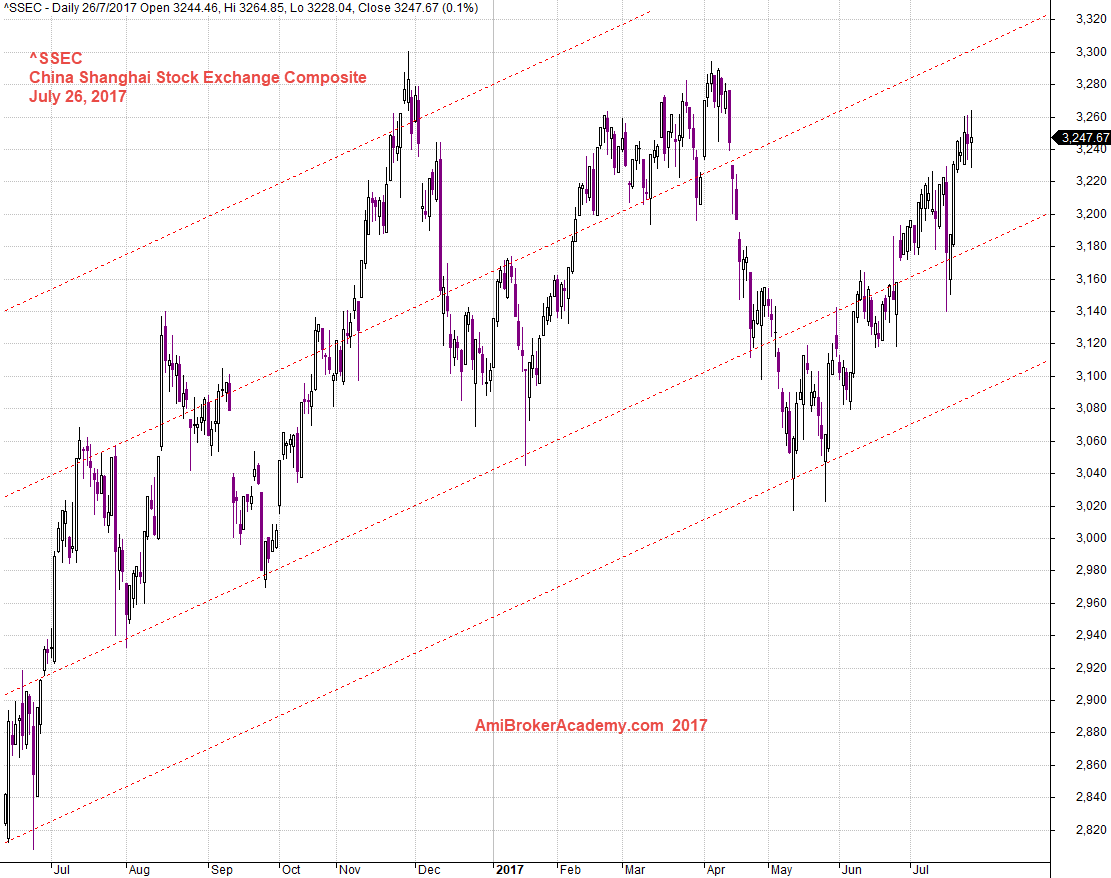
Slopping Up ^SSEC China Shanghai Index and Channel
Channel slopping from bottom left to top right. Bullish bias. Picture worth a thousand words. See chart for more.
SSEC is now bounced off bottom channel line, and retest the last high. The Index may retrace down to the lower channel again first before the next cause of action. Watch! Watch out! Wait One More Day.
July 26, 2017 Shanghai SEC and Channel
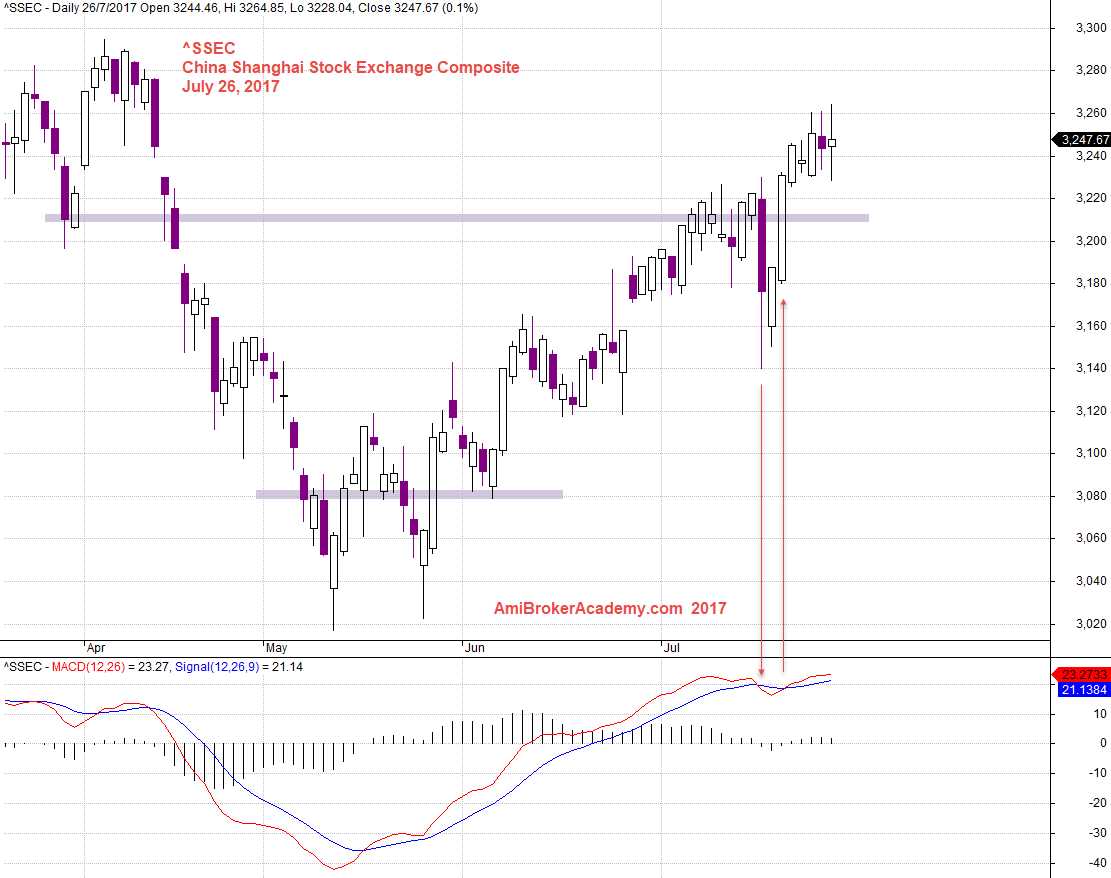
^SSEC and MACD
After we study the SSEC using channel, moving average, 34 MA band and now let’s see Shanghai Index from MACD indicator point of view.
What can you get from the chart?
MACD has a MACD Cross Up zeroline, the trend is bull, but lower than the last high. Besides the MACD fail to cross down. So the Strength got to be strong, but. …
July 26, 2017 China SSEC and MACD signal
^SSEC and Double Bottom
See the double bottom, see chart. Picture worth a thousand words.
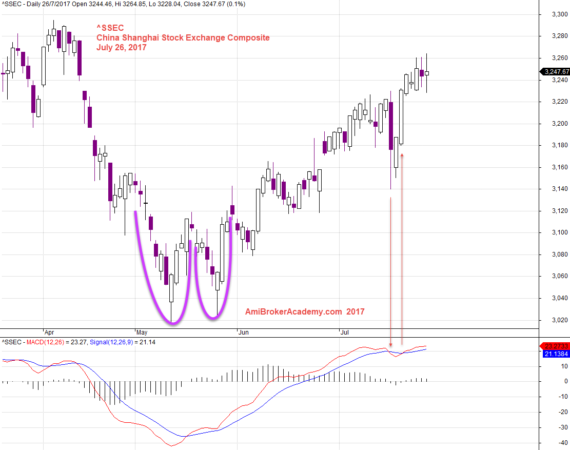
July 26, 2017 Shanghai Stock Exchange Composite and double bottom
See other analysis on Hong Kong Index and Singapore Index.
Thanks for visit the site here. You could also find free MACD scan here in this site too.
Moses
AmiBrokerAcademy.com
Disclaimer
The above result is for illustration purpose. It is not meant to be used for buy or sell decision. We do not recommend any particular stocks. If particular stocks of such are mentioned, they are meant as demonstration of Amibroker as a powerful charting software and MACD. Amibroker can program to scan the stocks for buy and sell signals.
These are script generated signals. Not all scan results are shown here. The MACD signal should use with price action. Users must understand what MACD and price action are all about before using them. If necessary you should attend a course to learn more on Technical Analysis (TA) and Moving Average Convergence Divergence, MACD.
Once again, the website does not guarantee any results or investment return based on the information and instruction you have read here. It should be used as learning aids only and if you decide to trade real money, all trading decision should be your own.