June 5, 2017
NASDAQ Bank Index
Picture worth a thousand words.
Big picture, the first part of the chart; before 2007 it was a fail bullish flag. Can you see it? Flag pole, followed by flag, … This is not a usual flag pattern, as the flag should be decline, but this one was rally up.
So, 2008 the market crash really bring everything back to the knee.
Now, the index is at some important level. It has completed a head and shoulders pattern. We may expecting a Gartley 222 sell, true or true? Trade what you see and not what you think! Watch out.
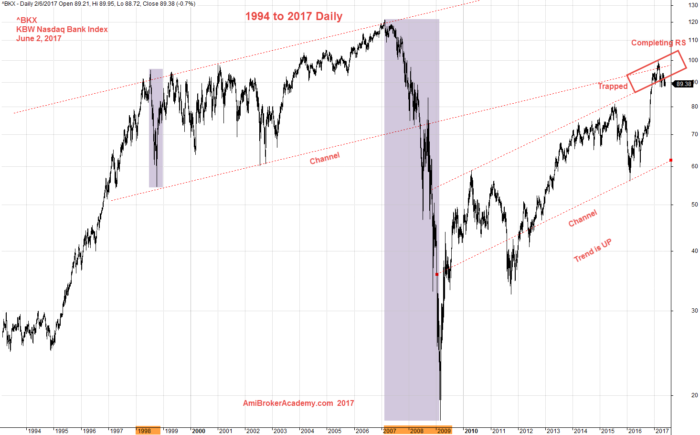
June 2, 2017 NASDAQ Bank Index 1994 to 2017
^BKX Charting and Support Resistance
Picture worth a thousand words.
We see the high and low of each year. We see the index is now near the resistance. The last time the index above the resistance was trapped. What will happen this round? Will see.
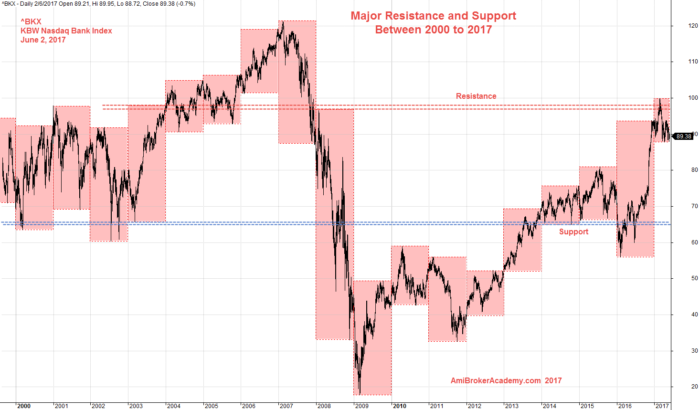
June 2, 2017 NASDAQ Bank Index 2000 to 2017 and Support Resistance
NASDAQ Bank Index Charting and MACD Indicator
Picture worth a thousand words.
We see index form a higher high and MACD form a lower high, divergence. We see head and shoulders, and a smaller head and shoulders.
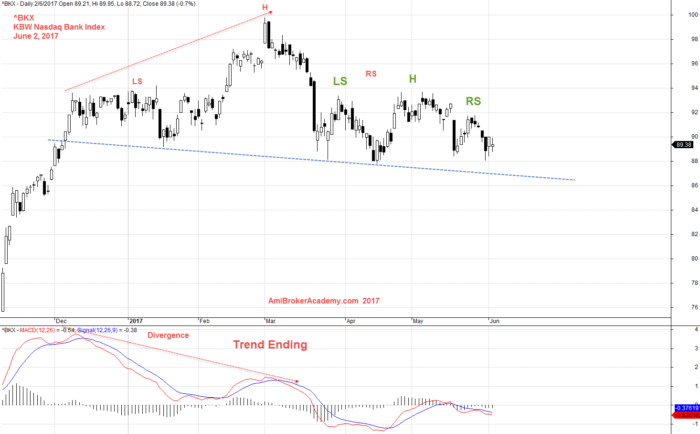
June 2, 2017 NASDAQ Bank Index and MACD Indicator
Bank Index and Head and Shoulders
Picture worth a thousand words. The right shoulder is approaching the neckline.
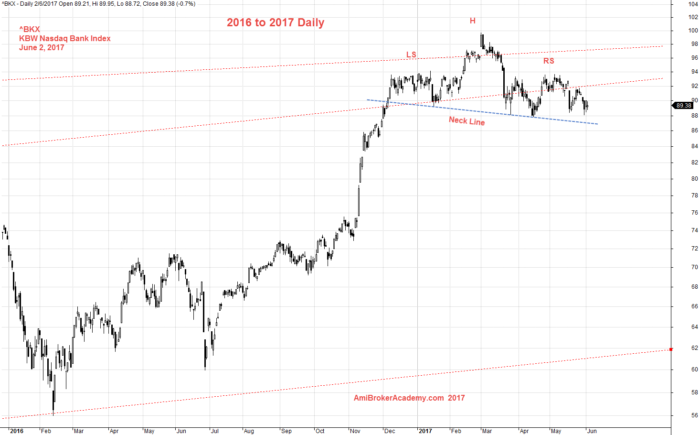
June 2, 2017 NASDAQ Bank Index and Head and Shoulders
The analysis here is intended to be a tutorial only. We look at the chart from different views. We mainly study the popular stocks in US market and Singapore. Hope you can learn something. There is no right no wrong.
Moses Stock Analysis
AmiBrokerAcademy.com
Disclaimer
The above result is for illustration purpose. It is not meant to be used for buy or sell decision. We do not recommend any particular stocks. If particular stocks of such are mentioned, they are meant as demonstration of Amibroker as a powerful charting software and MACD. Amibroker can program to scan the stocks for buy and sell signals.
These are script generated signals. Not all scan results are shown here. The MACD signal should use with price action. Users must understand what MACD and price action are all about before using them. If necessary you should attend a course to learn more on Technical Analysis (TA) and Moving Average Convergence Divergence, MACD.
Once again, the website does not guarantee any results or investment return based on the information and instruction you have read here. It should be used as learning aids only and if you decide to trade real money, all trading decision should be your own.