Moses’s US Stock Analysis, HiSoft Technology International Limited, HSFT
Moses’s US Stock Analysis, HiSoft Technology, HSFT has bounced back up since December 28, 2011 at $9.06. Can this be the low and the start of the bull trend? Will see.
Analysis
The price action has crossed up the 20 days EMA, but the price action has closed below the 50 EMA. Can the price action cross up the 50 EMA? Who will know?
From a bigger picture, the price action has completed a Gartley AB=CD pattern. It is likely to continue with the Bullish Gartley pattern. But wait, this is only valid when the pattern complete. Don’t forget, in the last analysis, the retest fail. In TA, the analysis is correct till it is proven wrong! Please trade with caution!
Will the break down at $10.58 become a bigger bear trap? Will see.
MACD bullish pattern, MACD crosses up MACD signal line, MACD histogram is above zero line.
What’s your trading plan (for HSFT)?
Would you fly an airplane without instruments? Of course you say you will not. Trading without a plan is just like fly an airplane without instruments. But how many of you trade with a plan. To know when to enter, when to exit and how long you will trade. You can have a one week plan, or a six months plan. As long as you plan.
Next is can you trade with your plan.
Trading is different from investment. Trading is through buy and sell to gain profit. Investment is different from trading. Investment is you park your money and expect it to grow. Unfortunately many is confused between the two.
Technical Analysis is a tool you analyze the history data to understand the trend, thereafter you make a trading plan. It does not matter the market is in bullish or bearish. You will still able to find an entry and exit point.
The market is always moving up and down. Or the market is always moved in a zigzag manner. As there is always buyers and sellers. When the supply is strong the price will fall, when the supply is weak the price will raise.
HiSoft Technology, HSFT Daily Chart Close up View
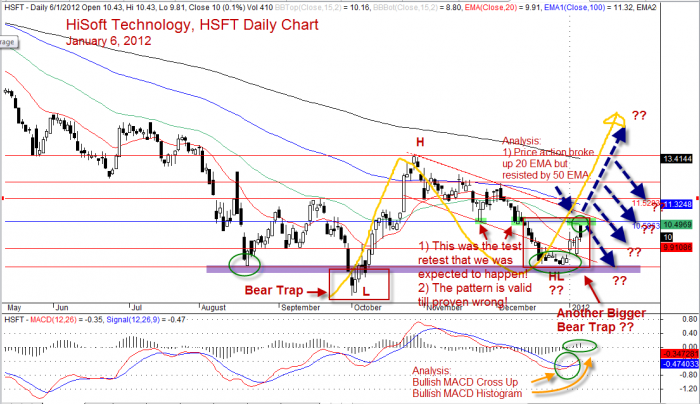
HiSoft Technology Daily Chart Closeup View, January 6, 2012
HiSoft Technology, HSFT Daily Chart
Completed Gartley AB = CD pattern. Is it forming a bullish Gartley pattern? Will see.
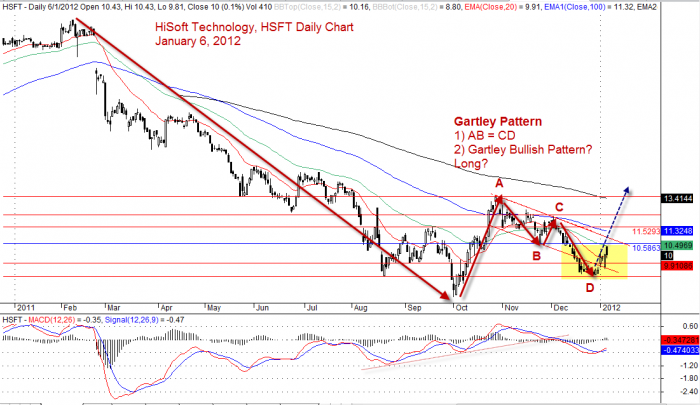
HiSoft Technology, HSFT Daily Chart, January 6, 2012, Gartley AB=CD
Other related post
US Stocks Analysis – HSFT December 11, 2011
Disclaimer
The above result is for education purpose. It is not meant to be used for buy or sell decision. We do not recommend any particular stocks. If particular stock of such is mentioned, they are meant as demonstration of Amibroker as a powerful charting software, what Technical Analysis is, some indicators such as MACD, Support and Resistance, and Moving Averages.
Once again, the website does not guarantee any results or investment return based on the information and instruction you have read here.
Leave a Reply
You must be logged in to post a comment.