US Stocks Analysis, HiSoft Technology International Limited, HSFT.
HSFT 52 week high was $34 and low was $8.02. What moves the stock price? Will the price form a lower bottom? Or the price is ready to bounce back to it high and goes higher.
Fundamental
HSFT, HiSoft Technology International Limited, started as an application outsourcing offshore centre back in November 1996 at Dalian, People’s Republic of China. HiSoft listed on NASDAQ on June 30, 2010. It became the 144th Chinese company listed on NASDAQ.
HiSoft has 7 delivery centres in China, 1 delivery centre in Singapore, plus 16 business offices in the US, Japan, Singapore, and China allow a mix of on-premise and offshore services.
The company has rapidly grown through strategic merger and acquisition. The company has evolved to today rendering services for technology, banking, financial services, and insurance industries. The company provides outsourcing in information technology, research and development services in Asia, North America, and Europe.
Some of the key services include functionality testing, globalization testing, localization testing, performance testing, security testing, and test automation.
HSFT was listed third in two categories on 2011 100 The Global Outsourcing from IAOP, International Association of Outsourcing Professionals. These are Best Leaders in Revenue Growth and Best Leaders in Employee Growth.
Stock Analysis
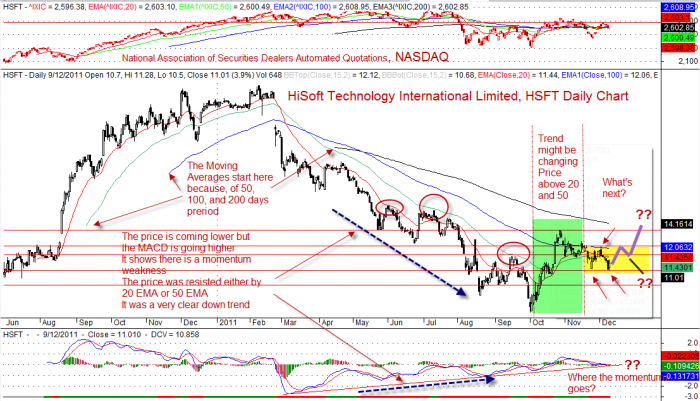
December 9, 2010 the market open at $10.7, the bull drove the price higher to $11.28, the bear fought back and brought the price to $10.5, the market ended at $11.01. The price has retested the support at $10.50. October 21, 2011 and November 23, 2011. Will the price get supported again at this level? Will see.
HSFT Daily Chart with NASDAQ correlation
This is what the Chart tells you. Trade what you see and not what you think. Is there any entry signal?
For it to return to the high and goes higher, it has many many resistance to clear. But there are less support to stop the price go lower. The price is moving in zigzag manner. In order for the price to move. It needs to accumulate, to build up enough ‘energy’, for either up or down. The market is made up of fears and greed.
HiSoft, HSFT and NASDAQ Daily Chart
HSFT Daily Chart with NASDAQ Zoom In
What is your trading plan?
What is your target?
Are you investor or trader?
What is your risk? What is your cut loss?
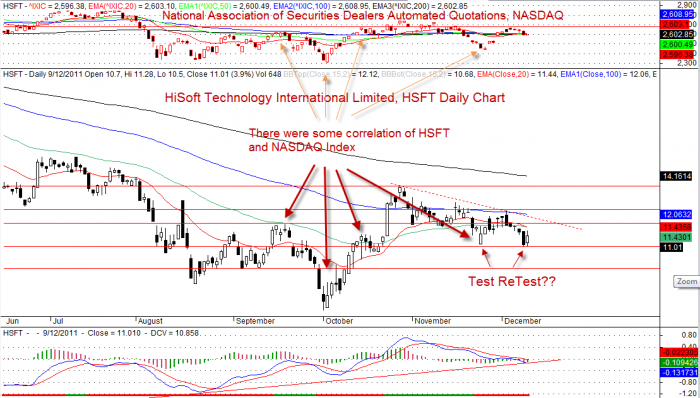
Hisoft, HSFT and NASDAQ Index Daily Chart closeup view
Disclaimer
The above result is for education purpose. It is not meant to be used for buy or sell decision. We do not recommend any particular stocks. If particular stock of such is mentioned, they are meant as demonstration of Amibroker as a powerful charting software, what Technical Analysis is, some indicators such as MACD, Support and Resistance, and Moving Averages.
Once again, the website does not guarantee any results or investment return based on the information and instruction you have read here.
Leave a Reply
You must be logged in to post a comment.