August 6, 2014
Moses’ Free Stock MACD Screening Results for August 4, 2014 Singapore Stocks
Welcome to Moses’s Stock Column at AmiBrokerAcademy.com. Thank you for visiting the site. Have you made money in Stock Market? One of the reasons you are here because you want to know which stocks will move. Stock trading is not a get rich quick tool. You must to have some experience.
Lesson
Random Walk and Non-Random Walk Hypotheses in Financial Market
In Financial market, they are two major hypotheses, or two schools of thought namely random walk hypothesis and non-random walk hypothesis.
Random Walk Hypothesis believes that the stock price cannot be predicted. Random Walk, the term was popularized after Burton Malkiel’s book A Random Walk Down Wall Street, in 1973. Burton Malkiel was a Professor of Economics at Princeton University. You can find the recently updated of his book at the bookshelf.
Non-Random Walk Hypothesis believes that stock market is somewhat predictable. There are trends in the stock market that you can follow. Professors Andrew W. Lo and Archie Craig MacKinlay at the MIT Sloan School of Management and the University of Pennsylvania have evidence shows the random walk hypothesis is incorrect.
So, which hypothesis is correct? Burton Malkiel finding or Andrew Lo and Archie Craig Mackinlay research is wrong. In real life, Dan Zanger, a stock technical analyst had turned $11,000 into $42 million, because he believes the stock prices are moved in certain trend and patterns. See the previous posting on Dan Zanger.
Now, does not matter who‘s right and who’s wrong. If you are not managing your risk, you are extremely wrong. Please take care of your risk; you will be start see the trend.
Free MACD Scan
This site provides you the free MACD scan for Singapore stocks.
This is August 4, 2014, Monday Singapore stocks that have the following MACD signals, which have trading volume greater than 500,000 shares.
Total 93 stocks have MACD bullish and bearish signals, only 15 stocks have bullish MACD signals, and 78 stocks have bearish MACD signals.
Only 45 stocks are traded more than 500,000 shares. Only 8 stocks have bullish MACD signals, and 37 stocks have bearish MACD signals. Looks the bulls are out of town. This can be seen in the Straits Times Index performance too. Sigh!
- MACD line crosses above MACD signal – Bullish trend
- MACD line crosses above zero line – Bullish trend
- MACD Histogram +ve Divergence – Bullish trend
- MACD line crosses below MACD signal – Bearish trend
- MACD line crosses below zero line – Bearish trend
- MACD Histogram -ve Divergence – Bearish trend
- Volume traded greater 500,000 shares
| Ticker | Company | Signals | Close | Vol.(K) | Screening Result |
| B20 | BIOSENSORS INT’L GROUP LTD. | Bullish | 0.855 | 2098 | MACD +ve Divergence |
| EB5 | FIRST RESOURCES LIMITED | Bullish | 2.3 | 1023 | MACD +ve Divergence |
| D3W | SINOTEL TECHNOLOGIES LTD. | Bullish | 0.059 | 977 | MACD Cross-Up Signal |
| B1ZU | RICKMERS MARITIME | Bullish | 0.3 | 879 | MACD Cross-Up Signal |
| P52 | PAN-UNITED CORPORATION LTD | Bullish | 1.08 | 742 | MACD Cross-Up Signal |
| S7P | SOILBUILD CONSTRUCTION GRP LTD | Bullish | 0.25 | 652 | MACD Cross-Up Signal |
| 595 | GKE CORPORATION LIMITED | Bullish | 0.091 | 529 | MACD +ve Divergence |
| 594 | LOYZ ENERGY LIMITED | Bullish | 0.27 | 519 | MACD-H +ve Divergence |
| G4F | OTTO MARINE LIMITED | Bearish | 0.07 | 16331 | MACD Cross-Down ZeroLine |
| A78 | LIONGOLD CORP LTD | Bearish | 0.073 | 12941 | MACD Cross-Down Signal |
| Z74 | SINGTEL | Bearish | 3.87 | 12408 | MACD Cross-Down Signal |
| C38U | CAPITAMALL TRUST. | Bearish | 1.955 | 9197 | MACD Cross-Down ZeroLine |
| F01 | VIBRANT GROUP LIMITED | Bearish | 0.117 | 8797 | MACD Cross-Down ZeroLine |
| 546 | MEDTECS INTERNATIONAL CORP LTD | Bearish | 0.072 | 8257 | MACD Cross-Down Signal |
| 5DN | EZRA HOLDINGS LIMITED | Bearish | 1.16 | 4935 | MACD Cross-Down ZeroLine |
| S21 | GENTING HONG KONG LIMITED | Bearish | 0.385 | 4834 | MACD Cross-Down Signal |
| RW0U | MAPLETREE GREATER CHINACOMM TR | Bearish | 0.91 | 4808 | MACD Cross-Down Signal |
| BS6 | YANGZIJIANG SHIPBLDG HLDGS LTD | Bearish | 1.07 | 4576 | MACD Cross-Down Signal |
| F34 | WILMAR INTERNATIONAL LIMITED | Bearish | 3.23 | 4509 | MACD Cross-Down Signal |
| I07 | ISDN HOLDINGS LIMITED | Bearish | 0.395 | 3860 | MACD Cross-Down Signal |
| P40U | STARHILL GLOBAL REIT | Bearish | 0.815 | 3677 | MACD Cross-Down ZeroLine |
| 5MC | BENG KUANG MARINE LIMITED | Bearish | 0.183 | 3601 | MACD Cross-Down Signal |
| SV3U | SOILBUILD BUSINESS SPACE REIT | Bearish | 0.795 | 3576 | MACD Cross-Down Signal |
| 5DE | EMS ENERGY LIMITED | Bearish | 0.064 | 2931 | MACD Cross-Down ZeroLine |
| 5UO | SYSMA HOLDINGS LIMITED | Bearish | 0.24 | 2671 | MACD Cross-Down Signal |
| DU4 | MERMAID MARITIME PUBLIC CO LTD | Bearish | 0.42 | 2020 | MACD Cross-Down Signal |
| Y34 | CHINA MINING INTERNATIONAL LTD | Bearish | 0.058 | 1982 | MACD Cross-Down Signal |
| S7OU | ASIAN PAY TELEVISION TRUST | Bearish | 0.85 | 1782 | MACD-H -ve Divergence |
| LJ3 | OUE LIMITED | Bearish | 2.37 | 1730 | MACD Cross-Down Signal |
| S51 | SEMBCORP MARINE LTD | Bearish | 4.1 | 1585 | MACD Cross-Down Signal |
| L03 | LIAN BENG GROUP LTD | Bearish | 0.7 | 1332 | MACD Cross-Down ZeroLine |
| F83 | COSCO CORPORATION (S) LTD | Bearish | 0.705 | 1217 | MACD Cross-Down ZeroLine |
| 566 | SEE HUP SENG LIMITED | Bearish | 0.285 | 1141 | MACD Cross-Down Signal |
| 5UZ | DECLOUT LIMITED | Bearish | 0.27 | 1064 | MACD Cross-Down Signal |
| P9J | GLOBAL PREMIUM HOTELS LIMITED | Bearish | 0.35 | 983 | MACD Cross-Down ZeroLine |
| 554 | KING WAN CORPORATION LIMITED | Bearish | 0.345 | 916 | MACD Cross-Down ZeroLine |
| U04 | UNITED ENGINEERS LTD ORD | Bearish | 2.33 | 895 | MACD Cross-Down ZeroLine |
| NO4 | DYNA-MAC HOLDINGS LTD. | Bearish | 0.38 | 893 | MACD Cross-Down ZeroLine |
| KF4 | SIN HENG HEAVY MACHINERY LTD | Bearish | 0.205 | 864 | MACD Cross-Down Signal |
| O32 | OLAM INTERNATIONAL LIMITED | Bearish | 2.43 | 856 | MACD Cross-Down ZeroLine |
| GG7 | HAI LECK HOLDINGS LIMITED | Bearish | 0.355 | 850 | MACD Cross-Down Signal |
| CT1 | AVI-TECH ELECTRONICS LIMITED | Bearish | 0.06 | 777 | MACD Cross-Down ZeroLine |
| 5VS | HAFARY HOLDINGS LIMITED | Bearish | 0.186 | 680 | MACD Cross-Down Signal |
| C09 | CITY DEVELOPMENTS LIMITED | Bearish | 10.27 | 589 | MACD Cross-Down Signal |
| 5FI | ORIENTAL GROUP LTD. | Bearish | 0.098 | 560 | MACD Cross-Down Signal |
Straits Times Index
August 4, 2014, Monday Straits Times Index, STI gaps down and closed at 3318.4 points, down 26.02 points from the last Friday closed at 3344.42 points. This has confirmed the bearish evening start candlestick pattern. The index is predicted to be resisted near 3311 points.
At this point, July 31, 2014 is the highest point for 2014.
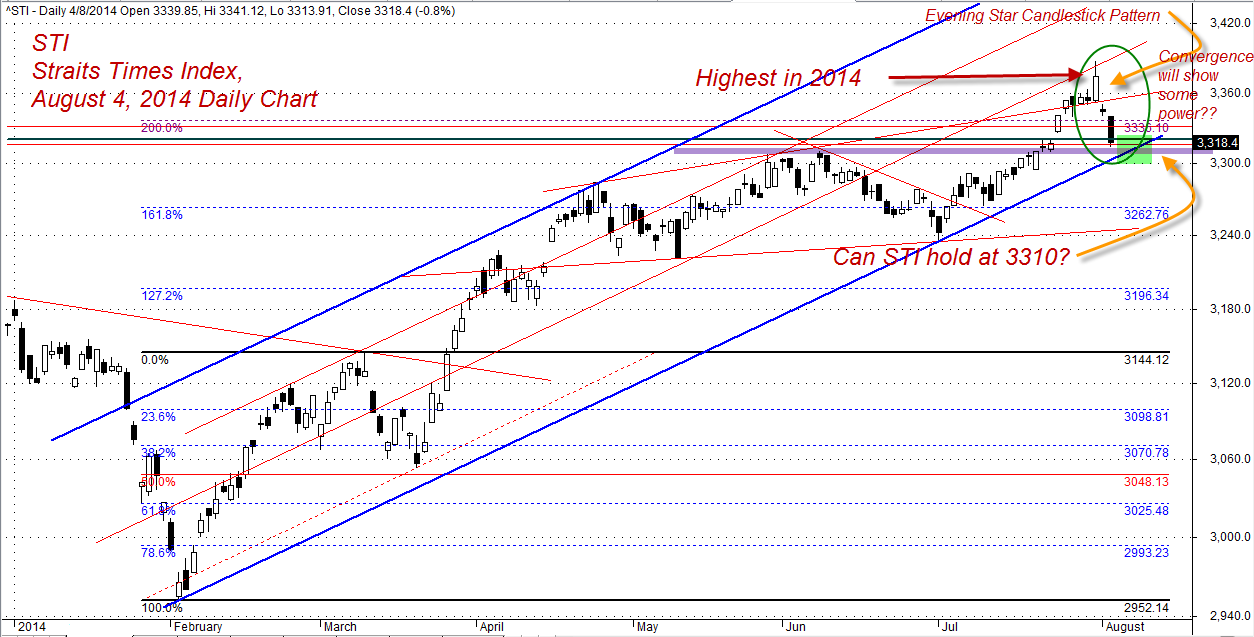
Window to Singapore Economy, Straits Times Index, STI August 4, 2014 Daily
Thanks for visiting the site, AmiBrokerAcademy.com.
Moses
DISCLAIMER
Information provided here is of the nature of a general comment only and no intend to be specific for trading advice. It has prepared without regard to any particular investment objectives, financial situation or needs. Information should not be considered as an offer or enticement to buy, sell or trade.
You should seek advice from your broker, or licensed investment advisor, before taking any action.
Once again, the website does not guarantee any results or investment return based on the information and instruction you have read here. It should be used as learning aids only and if you decide to trade real money, all trading decision should be your own.
Leave a Reply
You must be logged in to post a comment.