November 8, 2016
Moses’ Free Singapore Stock Analysis – November 8, 2016
^STI | The Straits Times Index Daily and Trapped Bulls
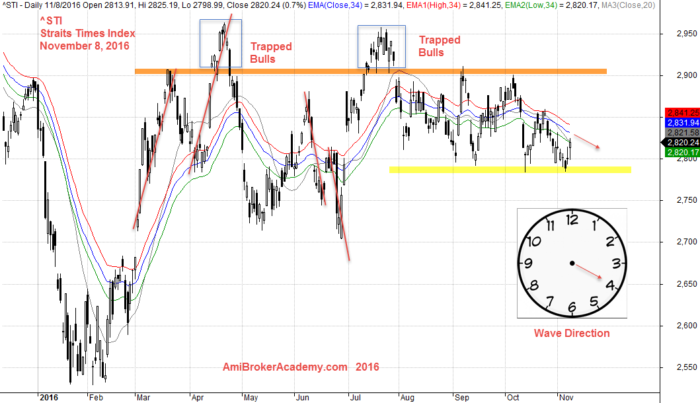
November 8, 2016 The Straits Times Index Daily and Trapped Bulls
Technical Analysis
Technical Analysts use price charts to interpret what is the most likely of the next move or moves. 34 EMA Wave is a great visual tool to know the trend direction. When the price action close below the Wave, and Wave is slopping down it is a clear downtrend. The opposite is true, in other words when the price action close above the Wave, and Wave is slopping up is is a clear uptrend.
The trend may be reversal. Wait for confirmation, such as price action formed low high. Have fun!
Moses Singapore Stock Analysis
AmiBrokerAcademy.com
DISCLAIMER
Information provided here is of the nature of a general comment only and no intend to be specific for trading advice. It has prepared without regard to any particular investment objectives, financial situation or needs. Information should not be considered as an offer or enticement to buy, sell or trade.
You should seek advice from your broker, or licensed investment advisor, before taking any action.
Once again, the website does not guarantee any results or investment return based on the information and instruction you have read here. It should be used as learning aids only and if you decide to trade real money, all trading decision should be your own.