April 26, 2015
Picture Worth a Thousand Words
The following charts are taken from the same period from different markets US and Asia. Benchmark them and see what clues you can obtain. A clear cut can easily identify is the ^VIX is moved in an opposite direction of the indexes.
1) Dow Jones Industrial Aveage
2) NASDAQ
3) S&P 500
4) Volatility S&P 500
5) Hang Seng Index
6) Nikkei 225
7) Straits Times Index
Dow Jones Industrial Average
^DJI

Dow Jones Industrial Average April 20, 2015
NASDAQ
^IXIC
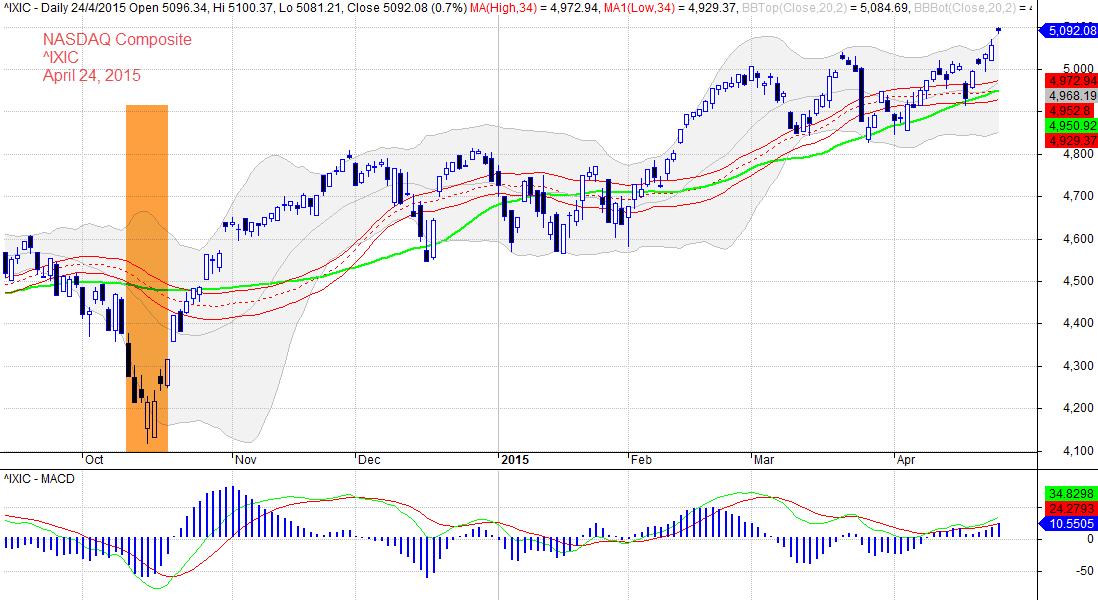
NASDAQ Composite 2015 04 24
S&P 500
^GSPC
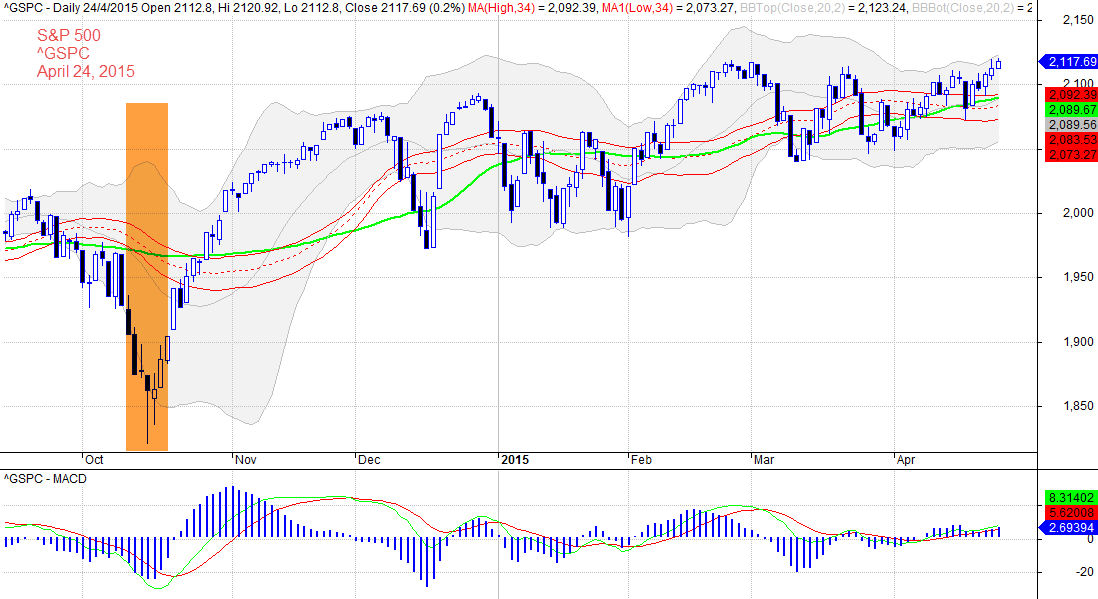
S&P 500 20150424
Volatility S&P 500
^VIX
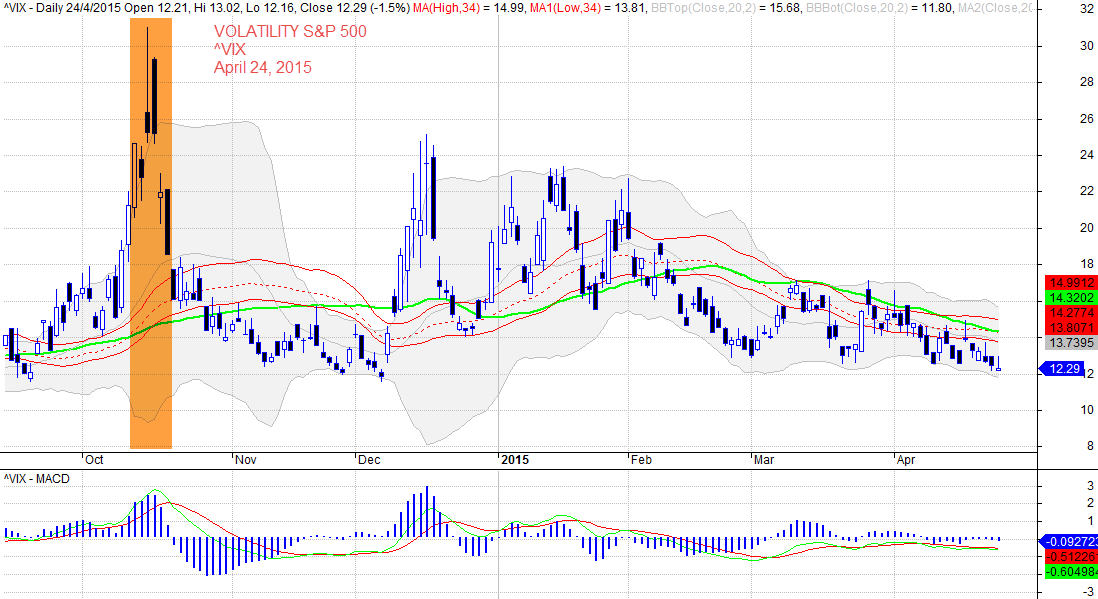
Volatility S&P 500 20150424
Hang Seng Index
^HSI
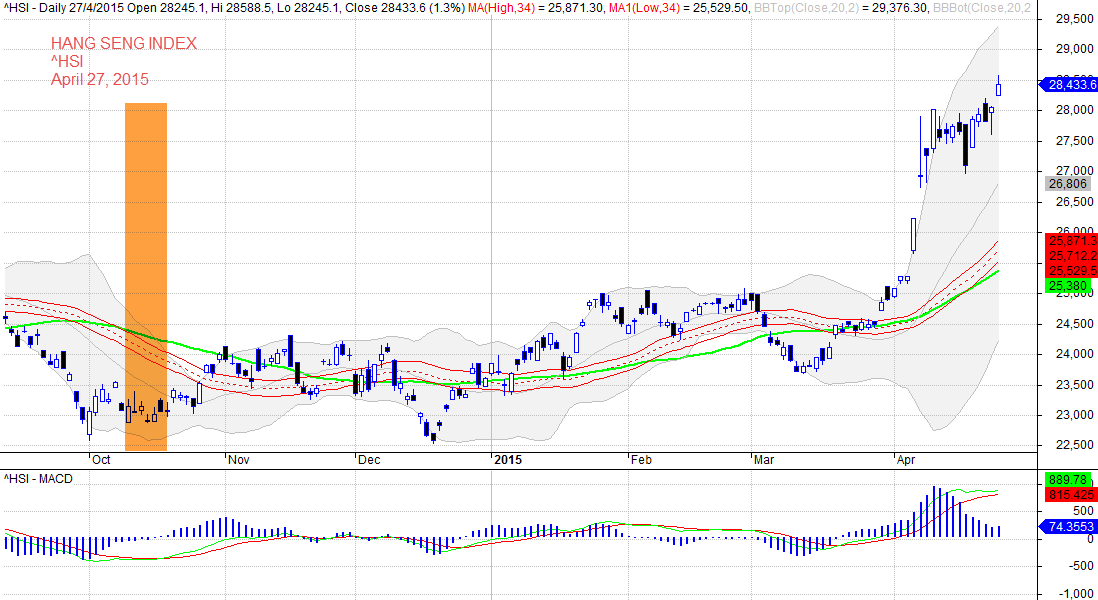
Hang Seng Index 20150427
Nikkei 225
^N225
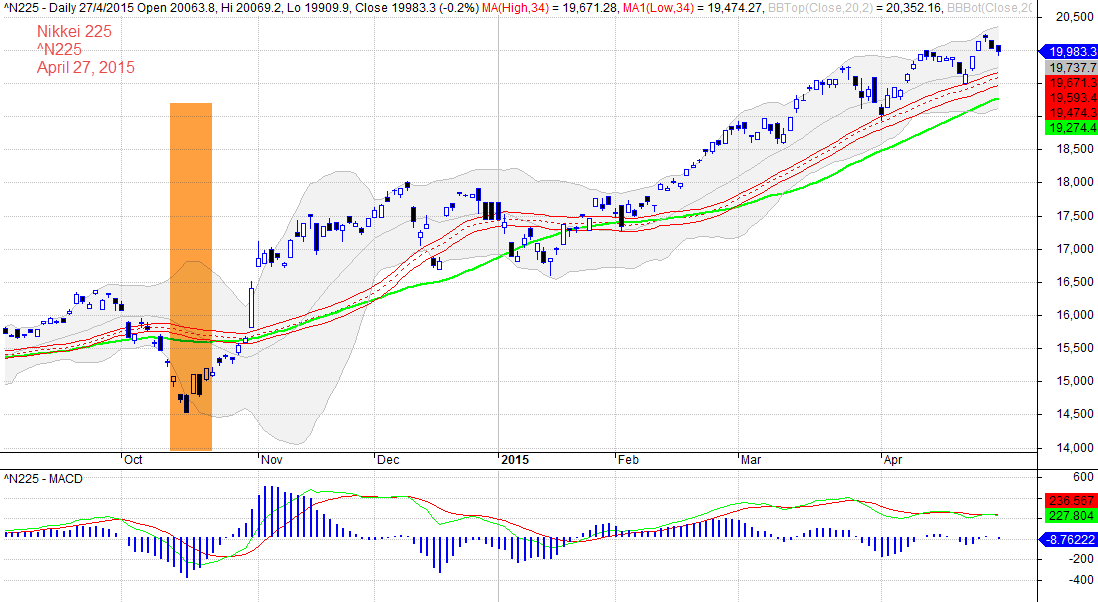
Nikkei 225 201504 27
Straits Times Index
^STI
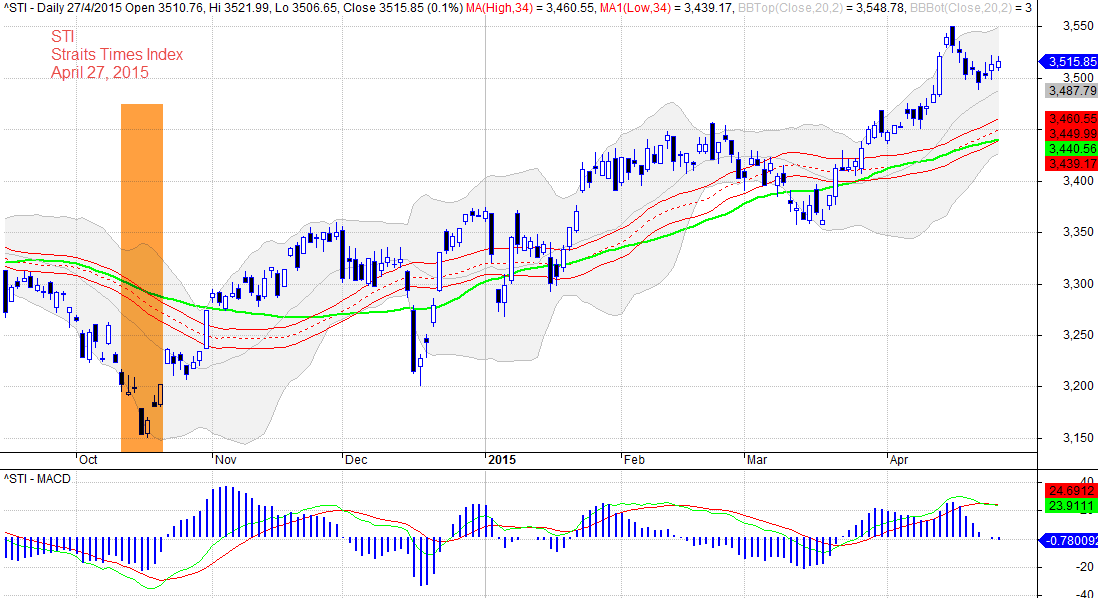
STI Straits Times Index, 20150427
Thanks for visit amibrokeracademy.com.
Moses
DISCLAIMER
Site advice, “Stock trading is not a get rich quick scheme and it is high risk”.
Information provided here is of the nature of a general comment only and no intend to be specific for trading advice. It has prepared without regard to any particular investment objectives, financial situation or needs. Information should NOT be considered as an offer or enticement to buy, sell or trade.
You should seek advice from your broker, or licensed investment advisor, before taking any action.
The website does not guarantee any results or investment return based on the information and instruction you have read here. It should be used as learning aids.