July 21, 2017
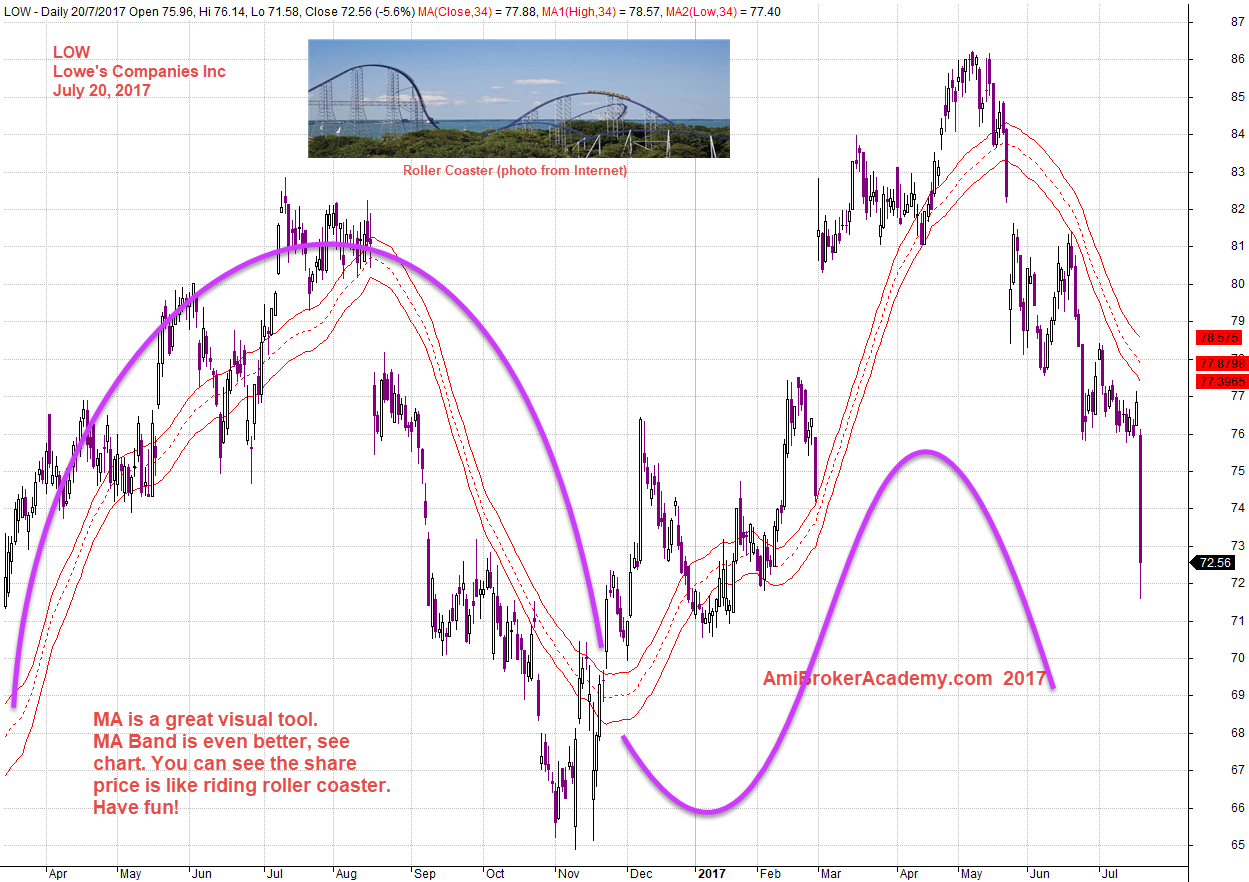
I am not young, I can not stand the ride. Lowe’s share price is exactly like the roller coaster riding. See chart for details.
LOW Lowe’s Companies and Major Ride
See chart for more, picture worth a thousand words.
Share price riding above the MA, cross down go under the MA, cross back up again, stay on top of the MA, cross below again. Wow! What a ride! My heart can not take it, can you?
Since March last year LOW share price riding high, pullback, the trend continue, pullback the trend continue again. Suddenly after a few retest, the market just given up and gap down. Now the share price try to pullback but the down trend continue. The share price has met a very strong floor, the stock price start to shoot up, cross the 34 MA band, and start bouncing above the 34 MA band. The uptrend can not last long, after this year May the stock price cross lower then the 34 MA band. The share price keep resisted by the 34 MA band.
If you have buy the share in last Marh, as show in the chart and you are still holding it. You are back to the square one, zero gain. How you feel?
The how period is like riding roller coaster, up down, down up, … This is only a fun ride.
July 20, 2017 Lowe’s Companies and the ride – Roller Coaster
LOW and MACD Singals
MACD is a great trend indicator, if the share price is like riding roller coaster, what can you see from MACD signals.
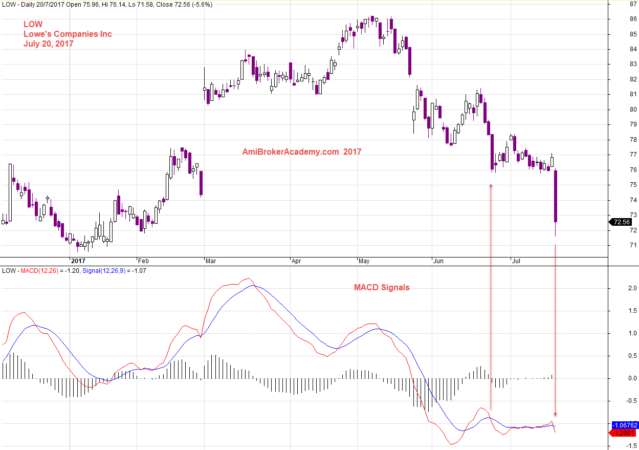
July 20, 2017 Lowe’s Companies and MACD Signals
Thanks for visit the site here. You could also find free MACD scan here in this site too.
Moses
AmiBrokerAcademy.com
Disclaimer
The above result is for illustration purpose. It is not meant to be used for buy or sell decision. We do not recommend any particular stocks. If particular stocks of such are mentioned, they are meant as demonstration of Amibroker as a powerful charting software and MACD. Amibroker can program to scan the stocks for buy and sell signals.
These are script generated signals. Not all scan results are shown here. The MACD signal should use with price action. Users must understand what MACD and price action are all about before using them. If necessary you should attend a course to learn more on Technical Analysis (TA) and Moving Average Convergence Divergence, MACD.
Once again, the website does not guarantee any results or investment return based on the information and instruction you have read here. It should be used as learning aids only and if you decide to trade real money, all trading decision should be your own.