September 16, 2017
Hello,
Thanks for being here again. Enjoy the reading here and have fun! We like to look at one of the work using Gartley 222, it is a great stock, or great company, Microsoft Corp. Let’s see what we did in one of our analysis. Have fun!
H M Gartley 222
Let show you another Gartley 222 ABCD Chart Pattern. If you here the first time, for your information. We sometime will google some of the stock code we analysed before. Just to understand how was the chart analysis. We apply what we learnt from our teacher. We believe in our teacher, we believe in technical analysis. So, we understand most of the analysis stand a sixty percent possibility right, ten percent more than the fifty percent. Because, we do not just apply one school of thought, we apply anything we were trained for.
If you our great fan, we hope you enjoy the posting here. Of course we sometime uses Chinese like English or Singapore English, Singlish. Okay lah!
MSFT | Microsoft Corporation | Moses’ US Stock Chart Analysis
Microsoft Corp MSFT and Gartley 222
Let’s see the outcome of the real trade, see chart for more. Picture worth a thousand words. Gartley 222 is easy to understand but may not easy to carry out. In this case, the results is the same as the earlier analysis.
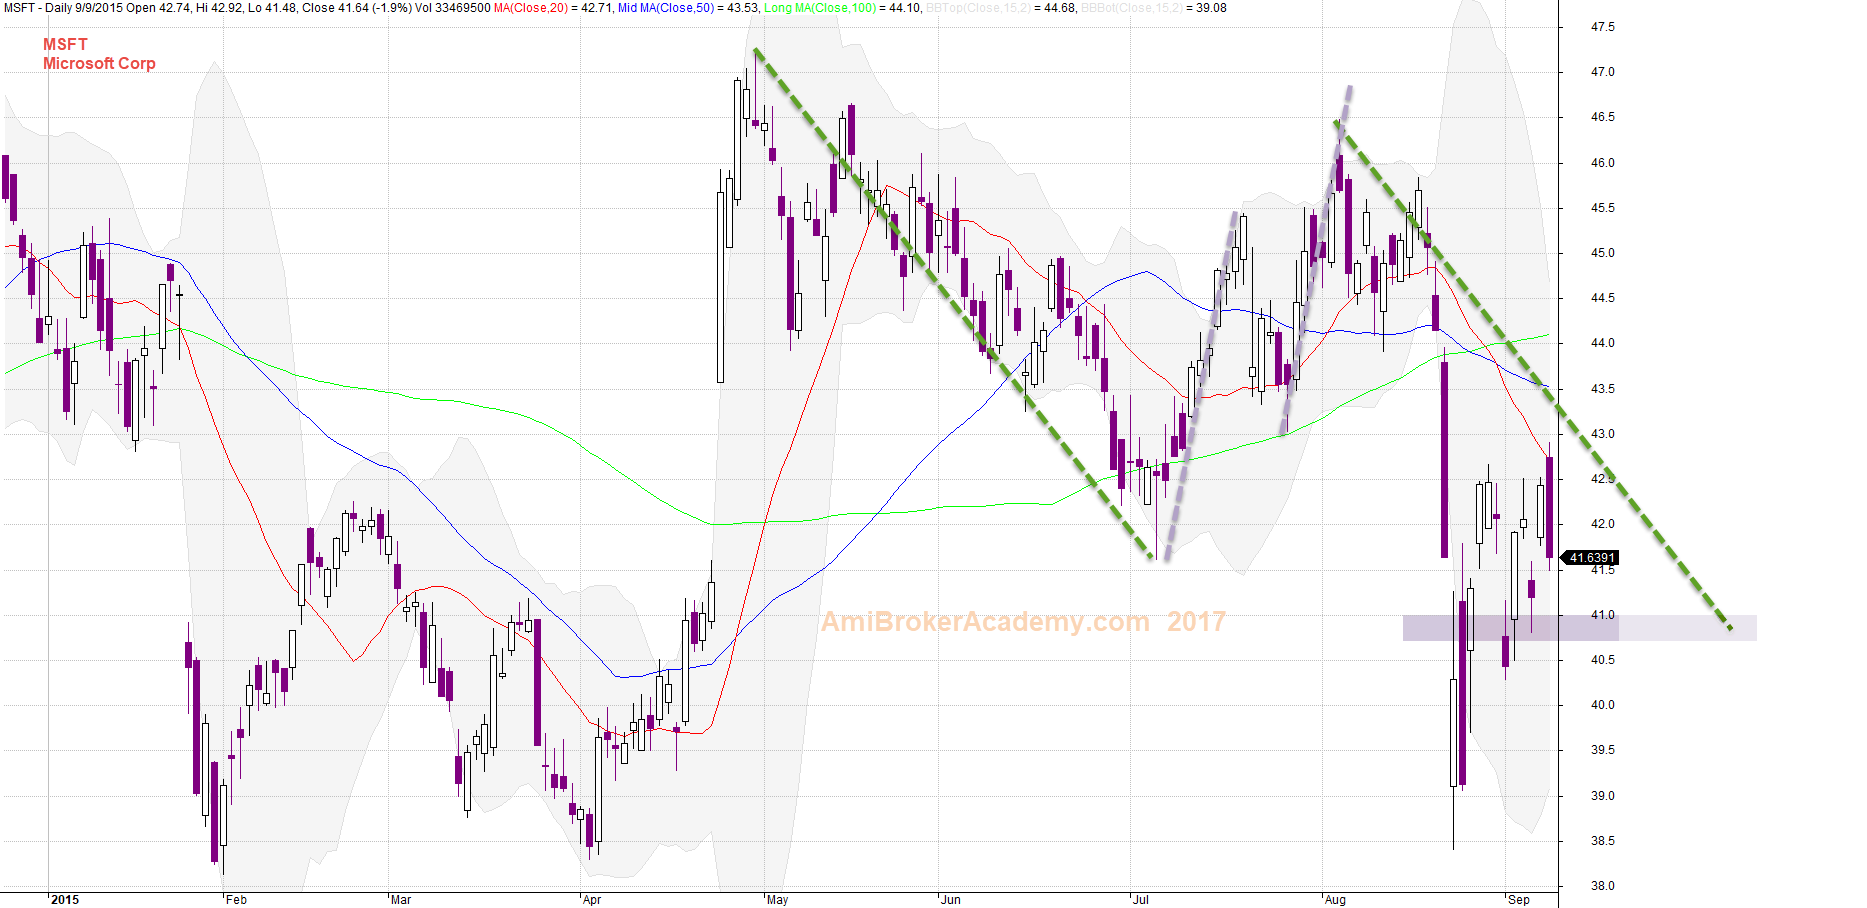
September 16 Microsoft Corp and Gartley 222 Lesson
Microsoft Corp MSFT and Fibonacci
If you use Fibonacci retracement and extension, and you will find the results was awesome.
Picture worth a thousand words, see chart for more. the price retrace back to 76 percent before continue the trend. The price action almost hit 161 percent in extension.
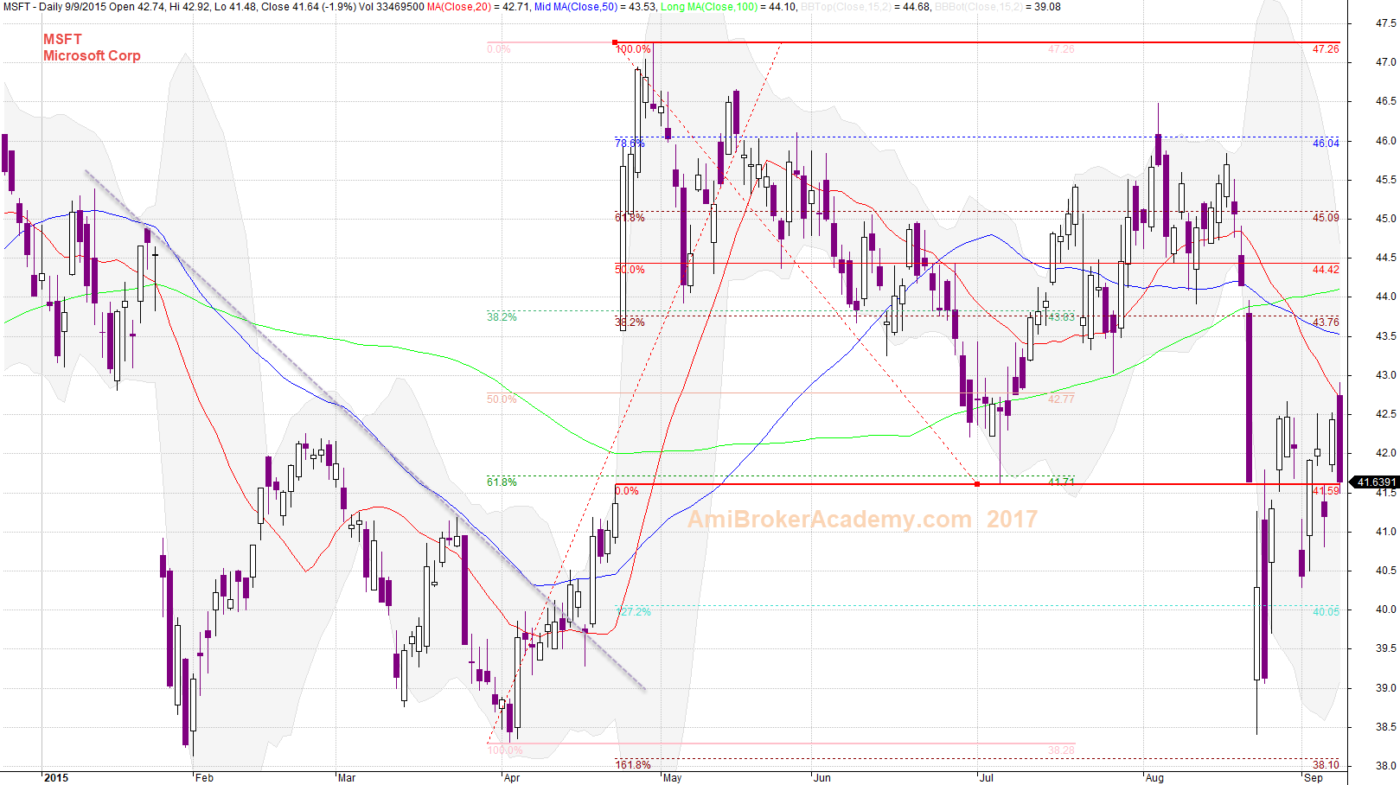
Microsoft Corp and Fibonnaci and Lesson
DISCLAIMER
Website advice, “Stock trading is not a get rich quick scheme and it is high risk”.
Information provided here is of the nature of a general comment only and no intend to be specific for trading advice. It has prepared without regard to any particular investment objectives, financial situation or needs. Information should NOT be considered as an offer or enticement to buy, sell or trade.
You should seek advice from your broker, or licensed investment advisor, before taking any action.
The website does not guarantee any results or investment return based on the information and instruction you have read here. It should be used as learning aids.
THE CONTENTS HERE REFLECT THE AUTHOR’S VIEWS ACQUIRED THROUGH HIS EXPERIENCE ON THE TOPIC. THE AUTHOR OR WEBSITE DISCLAIMS ANY LOSS OR LIABILITY CAUSED BY THE UTILIZATION OF ANY INFORMATION PRESENTED HEREIN.
BESIDES THAT THE SOURCES MENTIONED HEREIN ARE ASSUMED TO BE RELIABLE AT THE TIME OF WRITING, THE AUTHOR AND WEBSITE ARE NOT RESPONSIBLE FOR THEIR ACCURACY AND ACTIVITIES.
ALL PRODUCT NAMES, LOGOS, AND TRADEMARKS ARE PROPERTY OF THEIR RESPECTIVE OWNERS WHO HAVE NOT NECESSARILY ENDORSED, SPONSORED, REVIEWED OR APPROVED THIS PUBLICATION.