November 18, 2016
US Stock Analysis
Every week there are lesson to be learn. What have you learnt this week.
Topping? | ^IXIC | NASDAQ Composite Daily
ABCD Chart Pattern is a very simple chart pattern, connect the swing high to swing low or vice verse, you will get the first AB swing. Picture worth a thousand words, you should be about to figure out how the ABCD pattern look like.
ABCD Chart Pattern
HM Gartley mentioned the safest trade was to buy the ABCD corrections in a bull market.
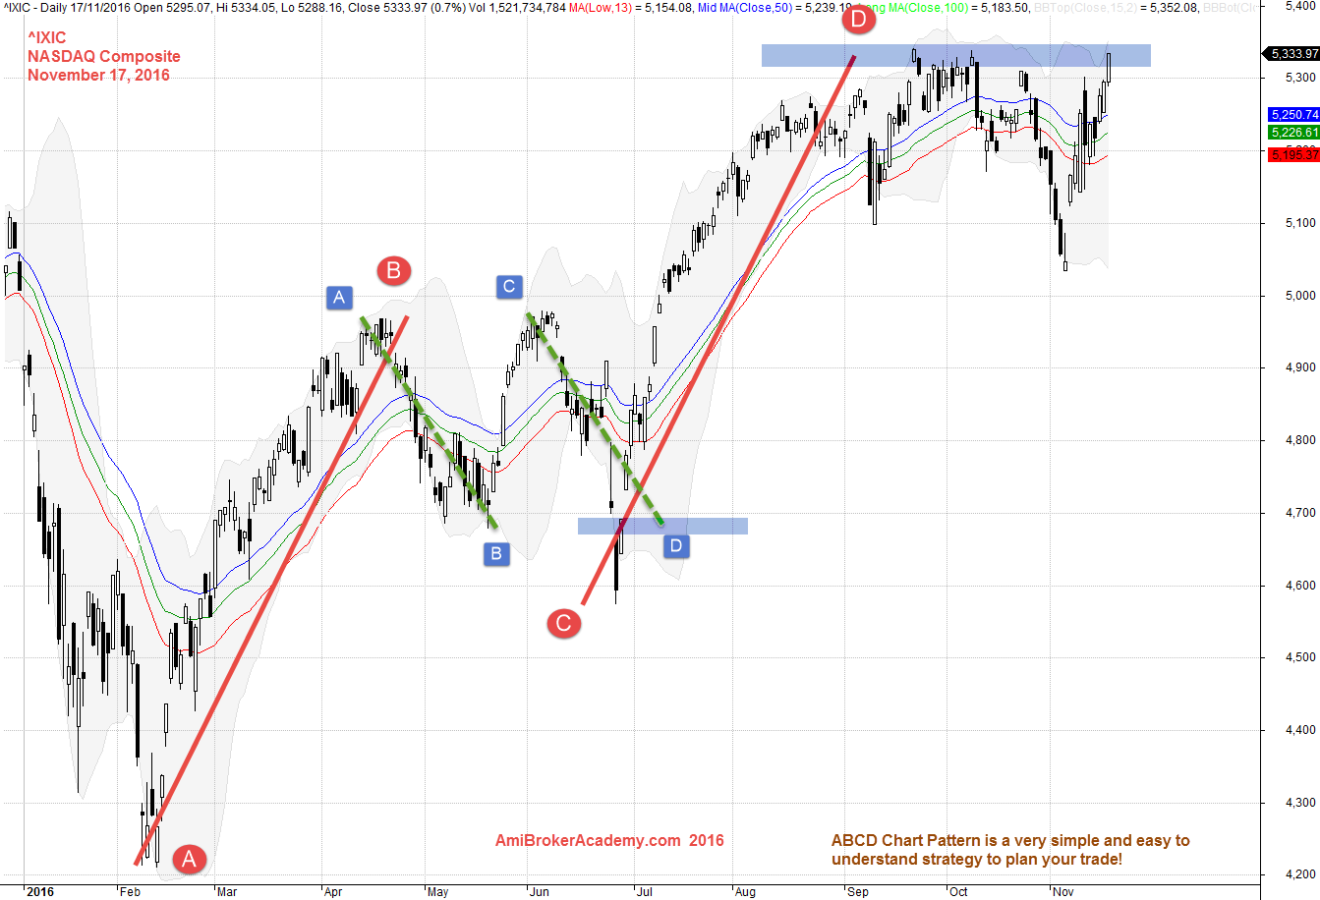
November 17, 2016 NASDAQ Composite Daily
^IXIC | NASDAQ Composite Daily
34 EMA Wave is a great visual tool too for deciding up or down trend. Picture worth a thousand words, when price action above the 34 EMA Wave it is uptrend. When price action below the 34 EMA Wave it is downtrend.
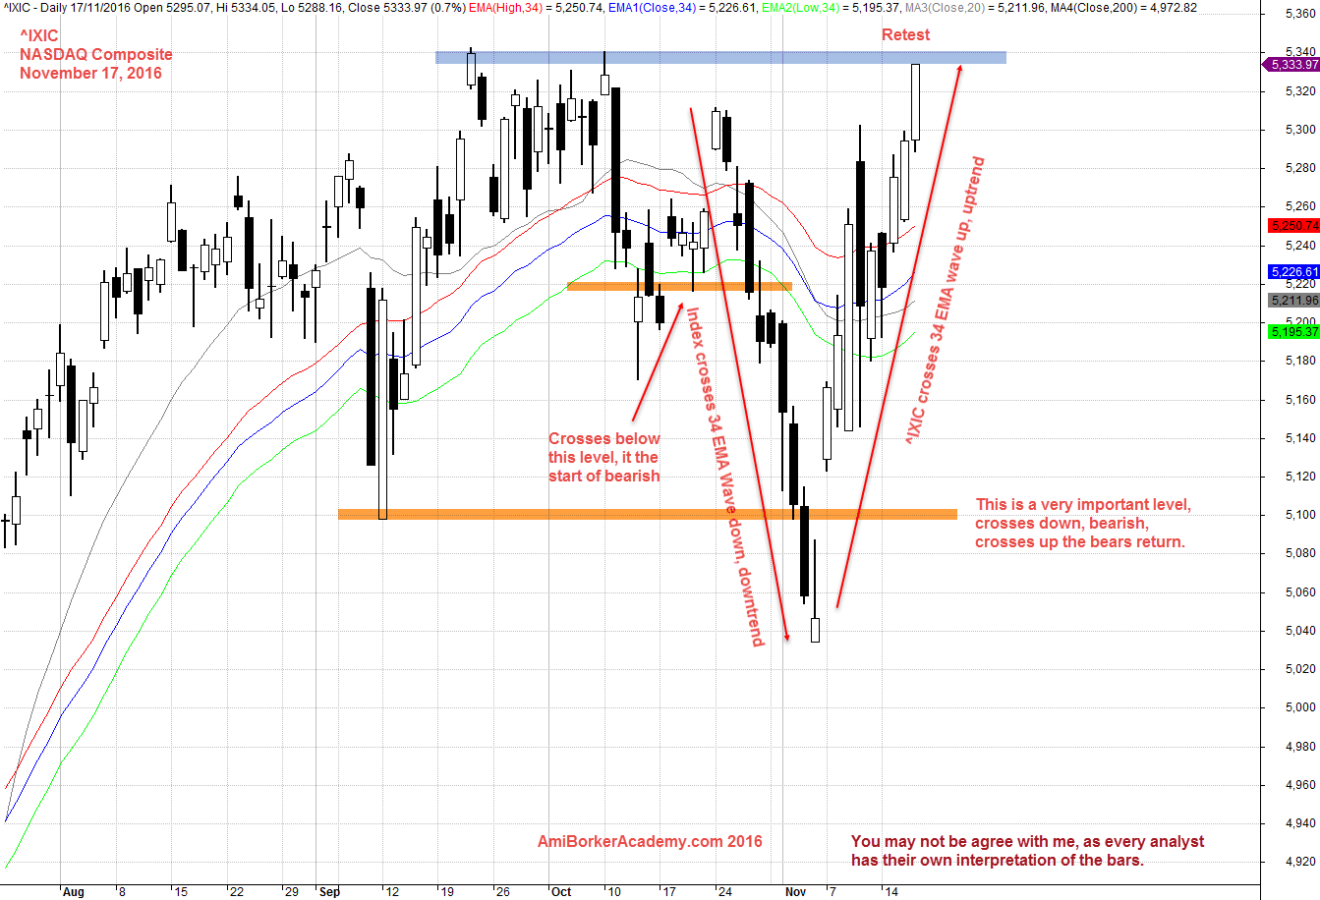
November 17, 2016 NASDAQ Composite Daily
Have fun!
Moses US Stock Desk
AmiBrokerAcademy.com
Disclaimer: All information, data and material contained, presented, or provided on amibrokeracademy.com is for educational purposes only. It is not to be construed or intended as providing trading or legal advice. Decisions you make about your trading or investment are important to you and your family, therefore should be made in consultation with a competent financial advisor or professional. We are not financial advisor and do not claim to be. Any views expressed here-in are not necessarily those held by amibrokeracademy.com. You are responsible for your trade decision and wealth being.