September 28, 2016
^GSPC S&P 500 Weekly Charting
If the price action continue to be below the blue level, the index is bearish. Short when the index get resisted by the level again.
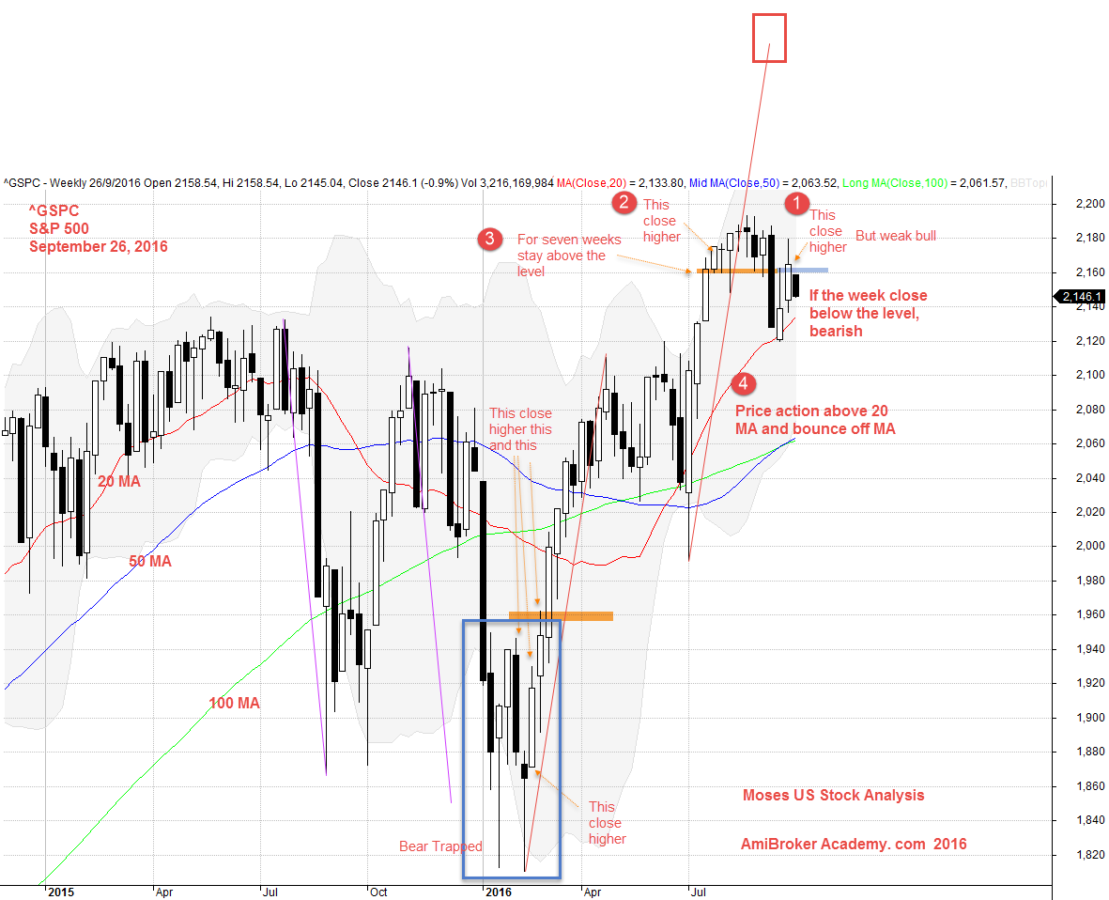
September 26, 2016 S&P 500 Weekly Chart
MACD and S&P 500 Weekly Charting
We could see many clues provided by the MACD; trend ending and beginning of a new trend. Will see.
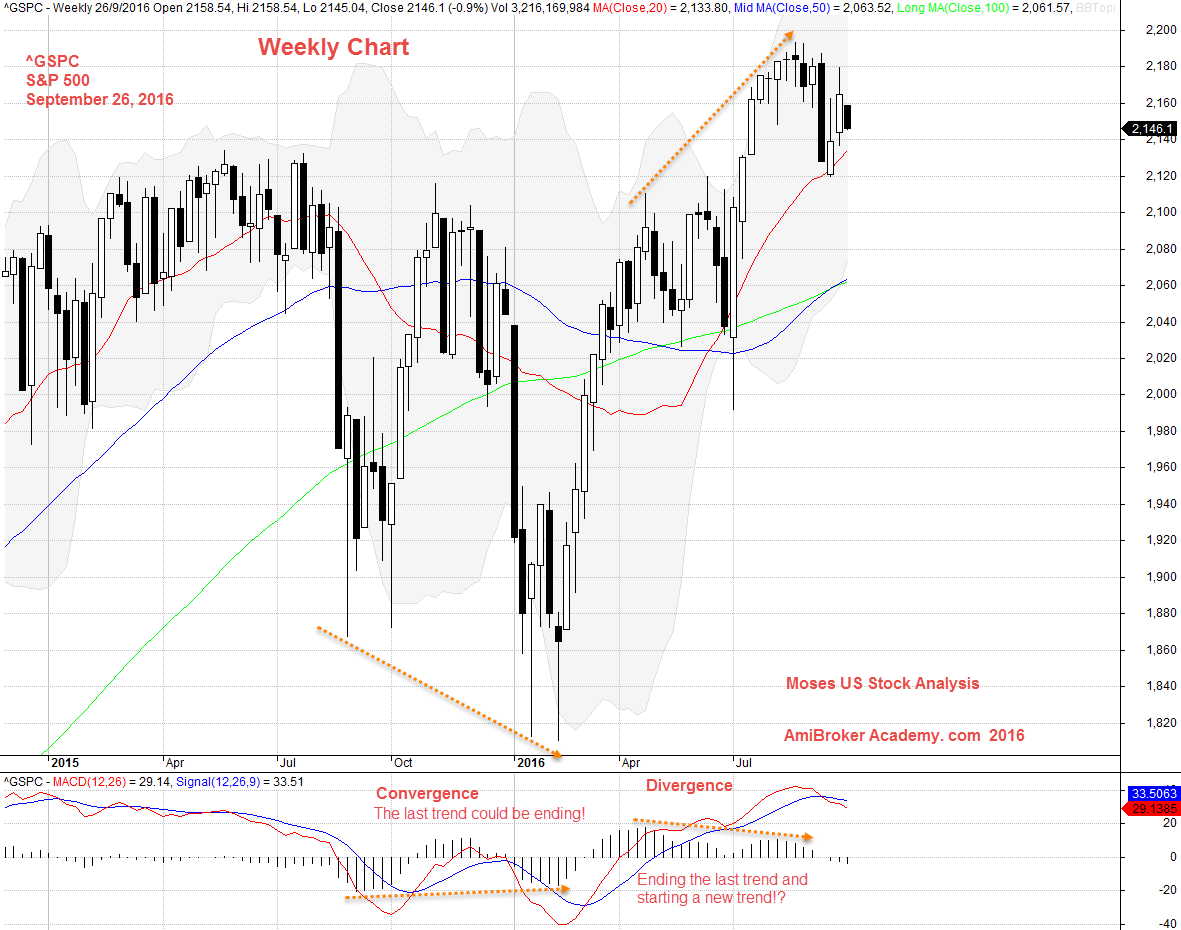
September 26, 2016 S&P 500 Weekly and MACD
Have fun!
Moses US Stock Analysis
AmiBrokerAcademy.com
Disclaimer: All information, data and material contained, presented, or provided on amibrokeracademy.com is for educational purposes only. It is not to be construed or intended as providing trading or legal advice. Decisions you make about your trading or investment are important to you and your family, therefore should be made in consultation with a competent financial advisor or professional. We are not financial advisor and do not claim to be. Any views expressed here-in are not necessarily those held by amibrokeracademy.com. You are responsible for your trade decision and wealth being.