February 3, 2018
Why Scanner?
To find a stock may move from nearly seven thousand (7000) stocks is not easy. Even if you only spend 1 second a stock, that means you will spend 7000 seconds. 7000 seconds equal to 116.66 minutes, equal to 1.9 hours.
Using a automated tools, like AFL scanner. It only takes you less than fifteen minues to identify a list like the one below. See the illustration of the February 1, MACD Scan. You then sort the list by price, by volume and so on. Pick what is within your means. Have fun learning!
Oscillator Moving Average Convergence Divergence
MACD is a popular trend following momentum indicator that shows the relationship of two moving averages of prices action; the MACD line and signal line.
Four MACD Signals:
- Crossovers – Sell Strategy, MACD crosses below the signal line. Buy Strategy, MACD rallies above the signal line. It is advisable to wait for confirmation to reduce possible whipsaw.
- Divergence – The security price action diverges from the MACD. It signals the end of the current trend.
- Cross Zero Line – MACD moves above or below zero line. Upward trend: Cross above zero line, short MA above long MA. Downward trend: Cross below zero line, short MA below long MA.
- Dramatic rise or fall – MACD rises or decline dramatically – when the shorter moving average pulls away from the longer-term moving average – Oversold or Overbought.
Free One-day US Stock MACD Screening Results for 1 February 2018
Remember all setup can fail. This is true for all indicators. It is also true for MACD signals setup. See some of the MACD setup fail examples on this website.
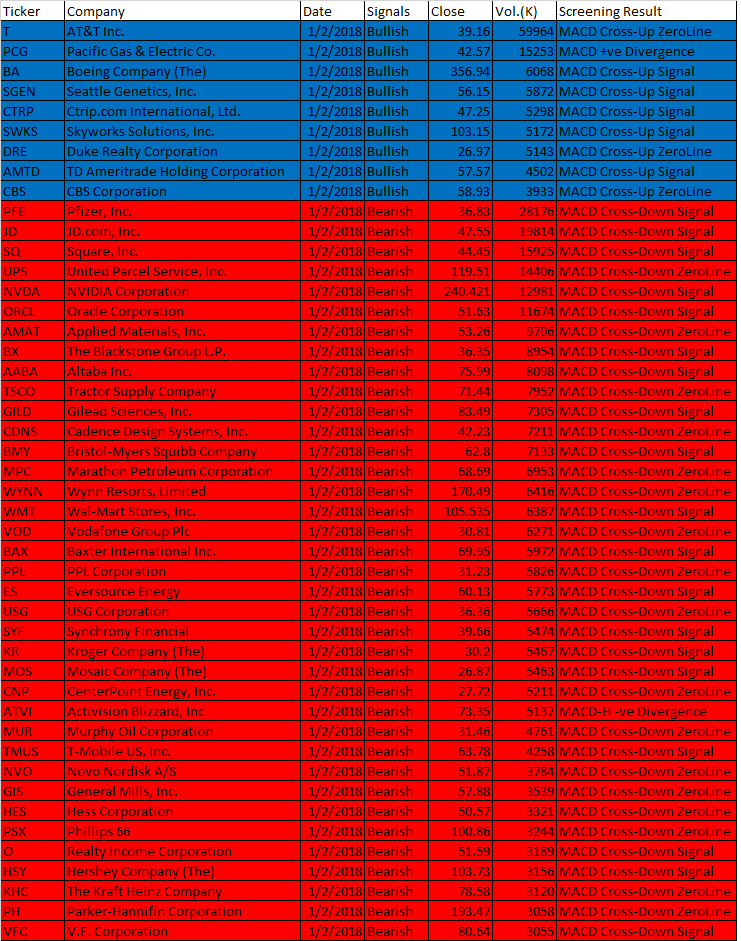
February 1, 2018 US Stock One-day MACD Signals
- MACD line crosses above MACD signal – Bullish trend
- MACD line crosses above zero line – Bullish trend
- MACD Histogram +ve Divergence – Bullish trend
- MACD line crosses below MACD signal – Bearish trend
- MACD line crosses below zero line – Bearish trend
- MACD Histogram -ve Divergence – Bearish trend
| Ticker | Company | Date | Signals | Close | Vol.(K) | Screening Result |
| T | AT&T Inc. | 1/2/2018 | Bullish | 39.16 | 59964 | MACD Cross-Up ZeroLine |
| PCG | Pacific Gas & Electric Co. | 1/2/2018 | Bullish | 42.57 | 15253 | MACD +ve Divergence |
| BA | Boeing Company (The) | 1/2/2018 | Bullish | 356.94 | 6068 | MACD Cross-Up Signal |
| SGEN | Seattle Genetics, Inc. | 1/2/2018 | Bullish | 56.15 | 5872 | MACD Cross-Up Signal |
| CTRP | Ctrip.com International, Ltd. | 1/2/2018 | Bullish | 47.25 | 5298 | MACD Cross-Up Signal |
| SWKS | Skyworks Solutions, Inc. | 1/2/2018 | Bullish | 103.15 | 5172 | MACD Cross-Up Signal |
| DRE | Duke Realty Corporation | 1/2/2018 | Bullish | 26.97 | 5143 | MACD Cross-Up ZeroLine |
| AMTD | TD Ameritrade Holding Corporation | 1/2/2018 | Bullish | 57.57 | 4502 | MACD Cross-Up Signal |
| CBS | CBS Corporation | 1/2/2018 | Bullish | 58.93 | 3933 | MACD Cross-Up ZeroLine |
| PFE | Pfizer, Inc. | 1/2/2018 | Bearish | 36.83 | 28176 | MACD Cross-Down Signal |
| JD | JD.com, Inc. | 1/2/2018 | Bearish | 47.55 | 19814 | MACD Cross-Down Signal |
| SQ | Square, Inc. | 1/2/2018 | Bearish | 44.45 | 15925 | MACD Cross-Down Signal |
| UPS | United Parcel Service, Inc. | 1/2/2018 | Bearish | 119.51 | 14406 | MACD Cross-Down ZeroLine |
| NVDA | NVIDIA Corporation | 1/2/2018 | Bearish | 240.421 | 12981 | MACD Cross-Down Signal |
| ORCL | Oracle Corporation | 1/2/2018 | Bearish | 51.63 | 11674 | MACD Cross-Down Signal |
| AMAT | Applied Materials, Inc. | 1/2/2018 | Bearish | 53.26 | 9706 | MACD Cross-Down ZeroLine |
| BX | The Blackstone Group L.P. | 1/2/2018 | Bearish | 36.35 | 8954 | MACD Cross-Down Signal |
| AABA | Altaba Inc. | 1/2/2018 | Bearish | 75.99 | 8098 | MACD Cross-Down Signal |
| TSCO | Tractor Supply Company | 1/2/2018 | Bearish | 71.44 | 7952 | MACD Cross-Down ZeroLine |
| GILD | Gilead Sciences, Inc. | 1/2/2018 | Bearish | 83.49 | 7305 | MACD Cross-Down Signal |
| CDNS | Cadence Design Systems, Inc. | 1/2/2018 | Bearish | 42.23 | 7211 | MACD Cross-Down ZeroLine |
| BMY | Bristol-Myers Squibb Company | 1/2/2018 | Bearish | 62.8 | 7133 | MACD Cross-Down Signal |
| MPC | Marathon Petroleum Corporation | 1/2/2018 | Bearish | 68.69 | 6953 | MACD Cross-Down ZeroLine |
| WYNN | Wynn Resorts, Limited | 1/2/2018 | Bearish | 170.49 | 6416 | MACD Cross-Down ZeroLine |
| WMT | Wal-Mart Stores, Inc. | 1/2/2018 | Bearish | 105.535 | 6387 | MACD Cross-Down Signal |
| VOD | Vodafone Group Plc | 1/2/2018 | Bearish | 30.81 | 6271 | MACD Cross-Down ZeroLine |
| BAX | Baxter International Inc. | 1/2/2018 | Bearish | 69.95 | 5972 | MACD Cross-Down Signal |
| PPL | PPL Corporation | 1/2/2018 | Bearish | 31.23 | 5826 | MACD Cross-Down ZeroLine |
| ES | Eversource Energy | 1/2/2018 | Bearish | 60.13 | 5773 | MACD Cross-Down Signal |
| USG | USG Corporation | 1/2/2018 | Bearish | 36.36 | 5666 | MACD Cross-Down ZeroLine |
| SYF | Synchrony Financial | 1/2/2018 | Bearish | 39.66 | 5474 | MACD Cross-Down Signal |
| KR | Kroger Company (The) | 1/2/2018 | Bearish | 30.2 | 5467 | MACD Cross-Down Signal |
| MOS | Mosaic Company (The) | 1/2/2018 | Bearish | 26.87 | 5463 | MACD Cross-Down Signal |
| CNP | CenterPoint Energy, Inc. | 1/2/2018 | Bearish | 27.72 | 5211 | MACD Cross-Down ZeroLine |
| ATVI | Activision Blizzard, Inc | 1/2/2018 | Bearish | 73.35 | 5137 | MACD-H -ve Divergence |
| MUR | Murphy Oil Corporation | 1/2/2018 | Bearish | 31.46 | 4761 | MACD Cross-Down ZeroLine |
| TMUS | T-Mobile US, Inc. | 1/2/2018 | Bearish | 63.78 | 4258 | MACD Cross-Down Signal |
| NVO | Novo Nordisk A/S | 1/2/2018 | Bearish | 51.87 | 3784 | MACD Cross-Down ZeroLine |
| GIS | General Mills, Inc. | 1/2/2018 | Bearish | 57.88 | 3539 | MACD Cross-Down ZeroLine |
| HES | Hess Corporation | 1/2/2018 | Bearish | 50.57 | 3321 | MACD Cross-Down ZeroLine |
| PSX | Phillips 66 | 1/2/2018 | Bearish | 100.86 | 3244 | MACD Cross-Down ZeroLine |
| O | Realty Income Corporation | 1/2/2018 | Bearish | 51.59 | 3189 | MACD Cross-Down Signal |
| HSY | Hershey Company (The) | 1/2/2018 | Bearish | 103.73 | 3156 | MACD Cross-Down Signal |
| KHC | The Kraft Heinz Company | 1/2/2018 | Bearish | 78.58 | 3120 | MACD Cross-Down ZeroLine |
| PH | Parker-Hannifin Corporation | 1/2/2018 | Bearish | 193.47 | 3058 | MACD Cross-Down ZeroLine |
| VFC | V.F. Corporation | 1/2/2018 | Bearish | 80.64 | 3055 | MACD Cross-Down Signal |
Have fun!Users must understand what MACD is all about before using the results.
Moses Singapore Stock MACD Screening Signals
AmiBroker Academy.com
Disclaimer:
The above result is for illustration purpose. It is not meant to be used for buy or sell decision. We do not recommend any particular stocks. If particular stocks of such are mentioned, they are meant as demonstration of Amibroker as a powerful charting software and MACD. Amibroker can program to scan the stocks for buy and sell signals.
These are script generated signals. Not all scan results are shown here. The MACD signal should use with price action. Users must understand what MACD and price action are all about before using them. If necessary you should attend a course to learn more on Technical Analysis (TA) and Moving Average Convergence Divergence, MACD.
Once again, the website does not guarantee any results or investment return based on the information and instruction you have read here. It should be used as learning aids only and if you decide to trade real money, all trading decision should be your own.