November 23, 2014
Lesson
How the Stock Performed?
Facebook IPOed on May 18, 2012. It was the biggest in history for technology and Internet. The stock fell more than 50% after it opened. The stock fell from the high of 45 on the day one to the low of 18 in three months.
Now the stock hovers between 80 and 72.
The price action is above the River (make up from 34 high moving average and 34 low moving average). The price action is still bullish. However, the MACD has now in the bearish bias area.
Chart tells a thousand words, see the weekly chart since ipo and the daily chart for more information.
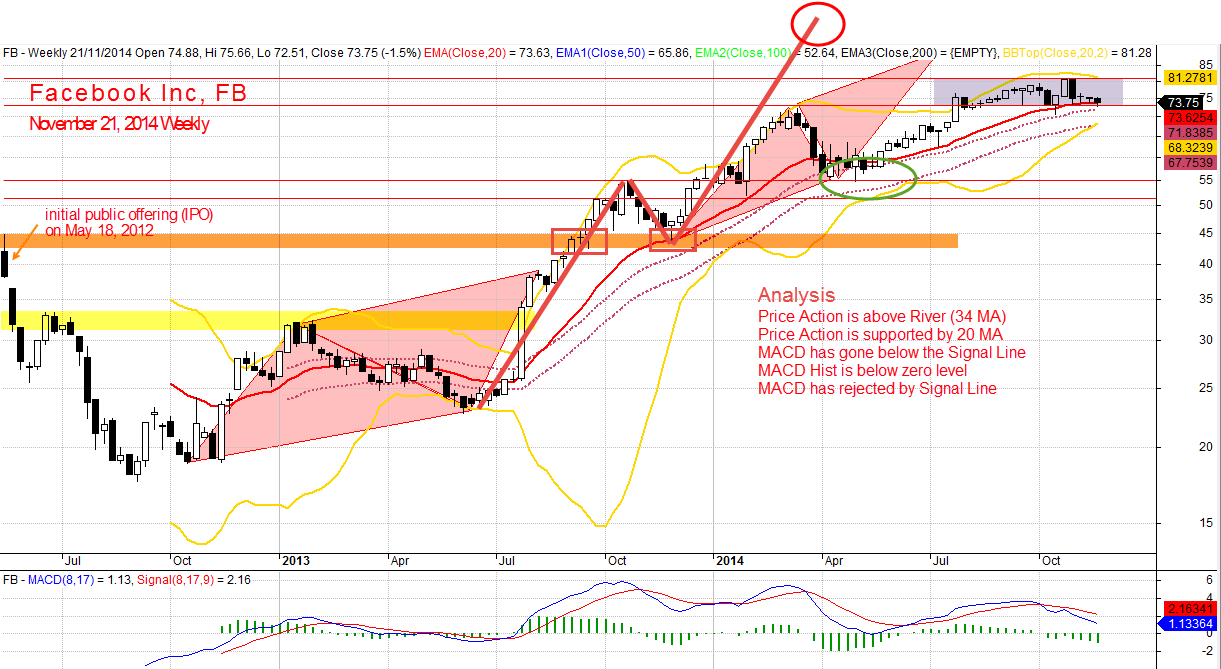
Facebook, FB Weekly Chart Since IPO, November 21, 2014
Go down to lower timeframe such as Daily to find early trigger. Picture worth a thousand words.
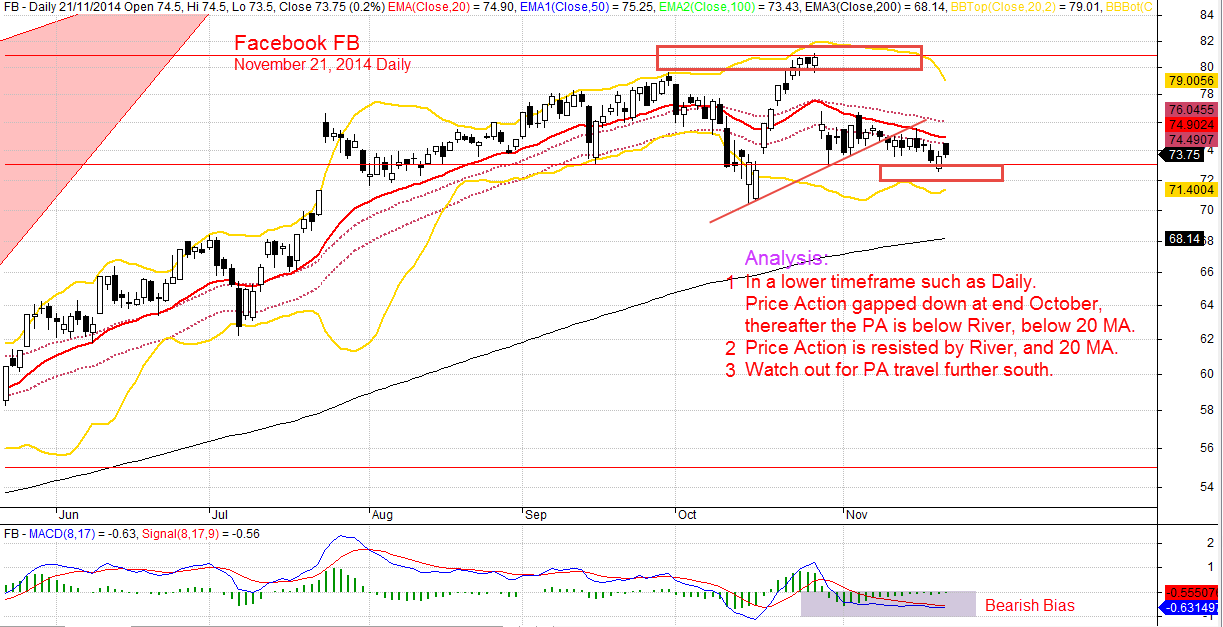
Facebook, FB November 21, 2014 Daily
Thanks for visiting the site.
Moses
DISCLAIMER
Information provided here is of the nature of a general comment only and no intend to be specific for trading advice.
It has prepared without regard to any particular investment objectives, financial situation or needs.
Information should not be considered as an offer or enticement to buy, sell or trade.
Trading is risky. Trading is personal. Everything is relative, there is no right or wrong.
You should seek advice from your broker, or licensed investment adviser, before taking any action.
The website does not guarantee any results or investment return based on the information and instruction you have read here and assume.
It should be used as learning aids only and if you decide to trade real money, all trading decision should be your own decision.
Also, any external links provide here are for easy reference. The opinions expressed by any of these links reference here are those of the authors and its site and do not necessarily reflect the positions of AmiBrokerAcademy.com.