China Shanghai Stock Exchange Index
Picture worth a thousand words, China Shanghai Stock Exchange Index swing from low to high from 2014. This is just the opposite from oil price, where in 2014 June the price when from high to low. It went from $115 a barrel to below $50 now. This comes after nearly five years of stability.
SSE hits the spike in May 2015. Since then, the index starts tumbling down. There were many effort to stable the fall.
Picture Worth a Thousand Words
Moving Average is a good visual aid for charting, SSE is down under below 100 MA, 50 MA is below 100 MA, 20 MA is below 50 MA. The conclusion the market is bearish.
Double Bottom
Only until the index has formed a high higher than the recent high; this will provide a hint on the change in direction, reversal. Otherwise, it will be just a bullback.
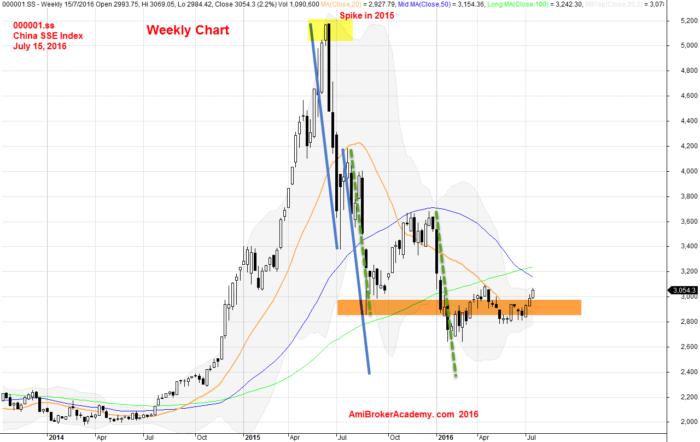
July 15, 2016 China Shanghai Stock Exchange Index Weekly Chart
Supply and Demand
In the stock market, there is always two sides of view. One see it is a good price to buy, and the other see it is time to take profit, sell. So, the economy in 2014 has sent the market up, it is time to buy. But after mid 2015, the market has changed their view and wanting to cash out.
Moses Stock Analysis and Scan
Disclaimer: All information, data and material contained, presented, or provided on amibrokeracademy.com is for educational purposes only. It is not to be construed or intended as providing trading or legal advice. Decisions you make about your trading or investment are important to you and your family, therefore should be made in consultation with a competent financial advisor or professional. We are not financial advisor and do not claim to be. Any views expressed here-in are not necessarily those held by amibrokeracademy.com. You are responsible for your trade decision and wealth being.