September 16, 2016
Buy Or Sell Can All Be Wrong – Stop Out!
Straits Times Index ended the week in Doji candlestick. STI joined the rest of the AP and US stock markets in declined after open on Tuesday.
How to trade when look at STI chart?
Trading in a ranging or sideways martket can be challenging. But if you are able to buy the support and sell resistance. You will be safe and make money. Can you? Not easy!
We will post our analysis later to show you how?
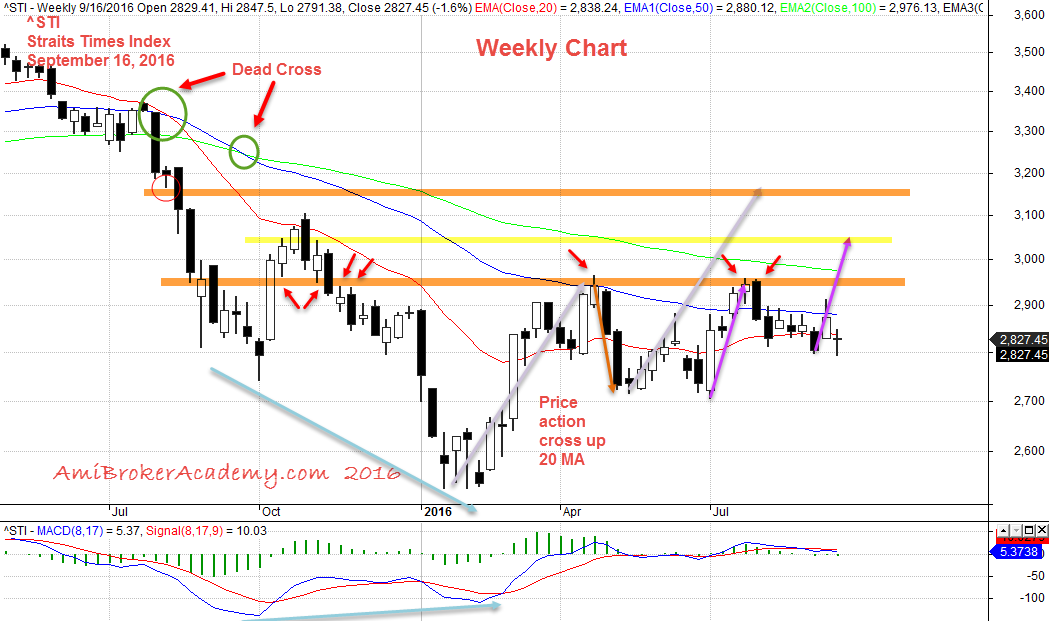
September 16. 2016 Straits Times Index Weekly Chart
Moses Singapore Stock Analysis
AmiBrokerAcademy.com
Disclaimer: All information, data and material contained, presented, or provided on amibrokeracademy.com is for educational purposes only. It is not to be construed or intended as providing trading or legal advice. Decisions you make about your trading or investment are important to you and your family, therefore should be made in consultation with a competent financial advisor or professional. We are not financial advisor and do not claim to be. Any views expressed here-in are not necessarily those held by amibrokeracademy.com. You are responsible for your trade decision and wealth being.