March 22, 2017
Moses Stock Trading Blog Site – AmiBrokerAcademy.com
Thank you for visiting the amibrokeracademy.com. No one doing analysis like what you read here.
BABA Alibaba Group Holding Weekly Chart Analysis
BABA went through double bottom, the price close above neckline, now the price is back to test the neckline again; resistance turn support.
Since 2017 the price has been on an uptrend.
If you have missed buying the stock, please wait for the pullback before you join the fun.
This week the price has been shy to breakout higher, the price has now moving south, see the last red candlestick.
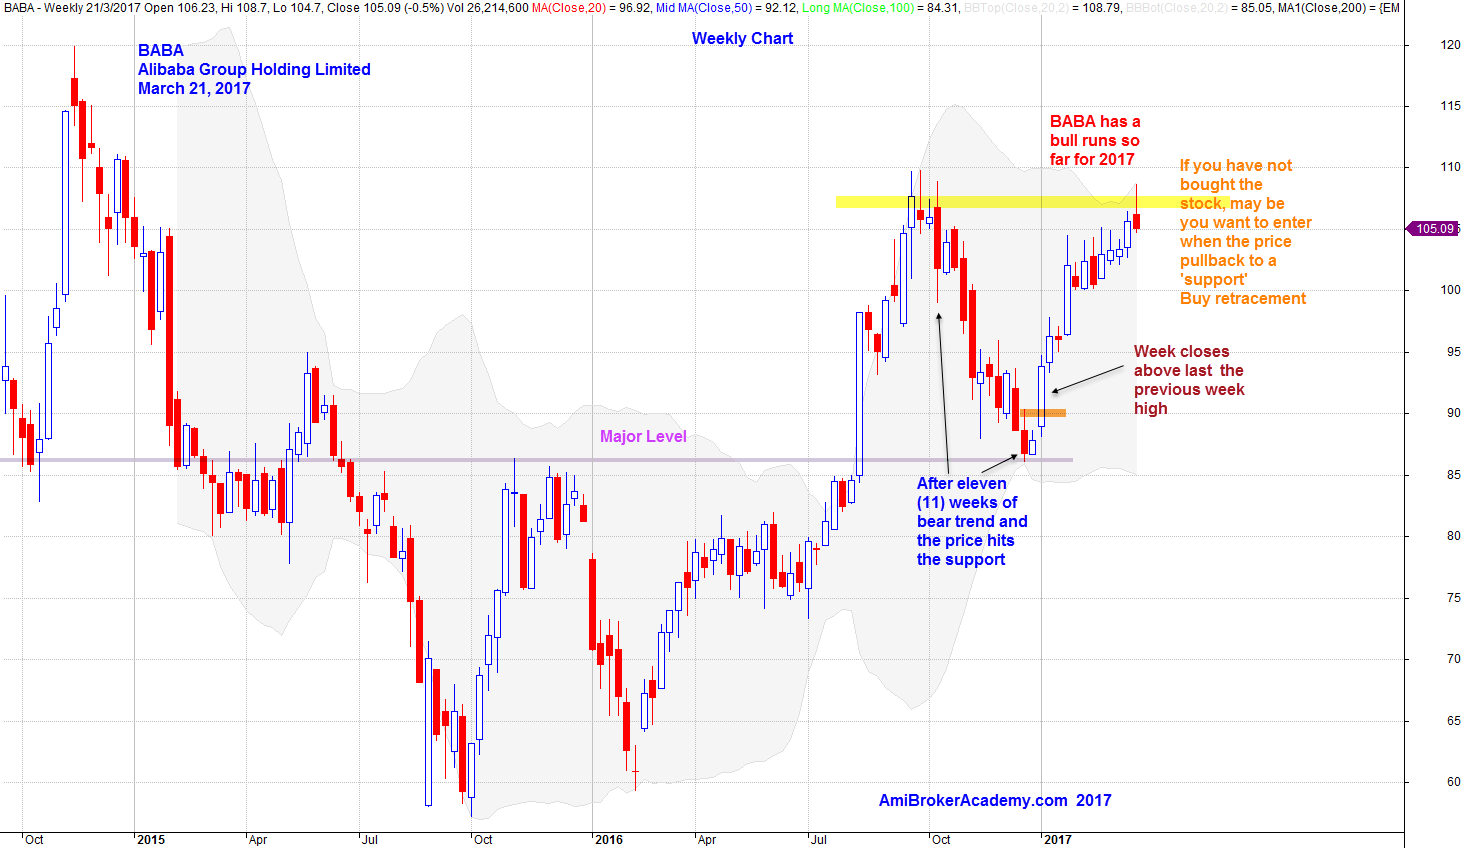
March 21, 2017 Alibaba Group Holding Weekly Chart
Have fun! Happy learning.
Moses US Stock Analysis
AmiBrokerAcademy.com
Disclaimer
The above result is for illustration purpose. It is not meant to be used for buy or sell decision. We do not recommend any particular stocks. If particular stocks of such are mentioned, they are meant as demonstration of Amibroker as a powerful charting software and MACD. Amibroker can program to scan the stocks for buy and sell signals.
These are script generated signals. Not all scan results are shown here. The MACD signal should use with price action. Users must understand what MACD and price action are all about before using them. If necessary you should attend a course to learn more on Technical Analysis (TA) and Moving Average Convergence Divergence, MACD.
Once again, the website does not guarantee any results or investment return based on the information and instruction you have read here. It should be used as learning aids only and if you decide to trade real money, all trading decision should be your own.