January 8, 2017
Gazing Crystal Ball and Planing the 2017 Trade

Crystal Ball – photo taken from internet.
“Almost since the birth of Apple Inc., critics have declared it was headed in the wrong direction.” read news from The Wall Street Journal Why Apple’s Critics Are Right This Time for details.
“… In 1997, when the company was 90 days from bankruptcy and Steve Jobs returned to save it, that criticism was correct. While things aren’t remotely as bad today, Apple’s critics are correct again. …”
US Stock Analysis – Apple Inc
With powerful charting software such as AmiBroker and data source such as Yahoo! Finance, you could look back as much as the data exist to study how the stock performance. The key in this chart is to see the trend and the pullback. You will be surprise to see the pullback has the almost same strength. You also evident the resistance turns support here. In fact the trading strategy are very much the experience we had in the past. That goes the logic behind the algo trading. The program built on the historical data, pattern and trend. With Algo trading, everything (the major trend) may be become predictable. Now, whatever you may think, it will all depend on the author of the program and the their risk taking.
Apple Inc Stock Price Data Since 1984
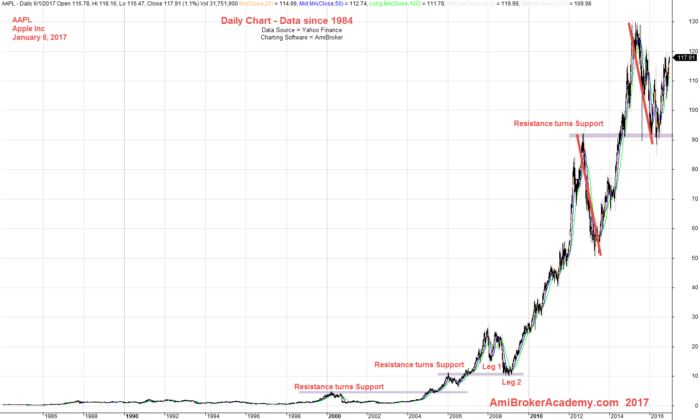
January 6, 2017 Apple Inc Daily Chart – Data Since 1984
Apple Inc Stock Price Data Since 2004
Catching a falling knife can be a calculated risk! If you understand what I illustrated here. But again it all depends as there is always has exception. Have fun!
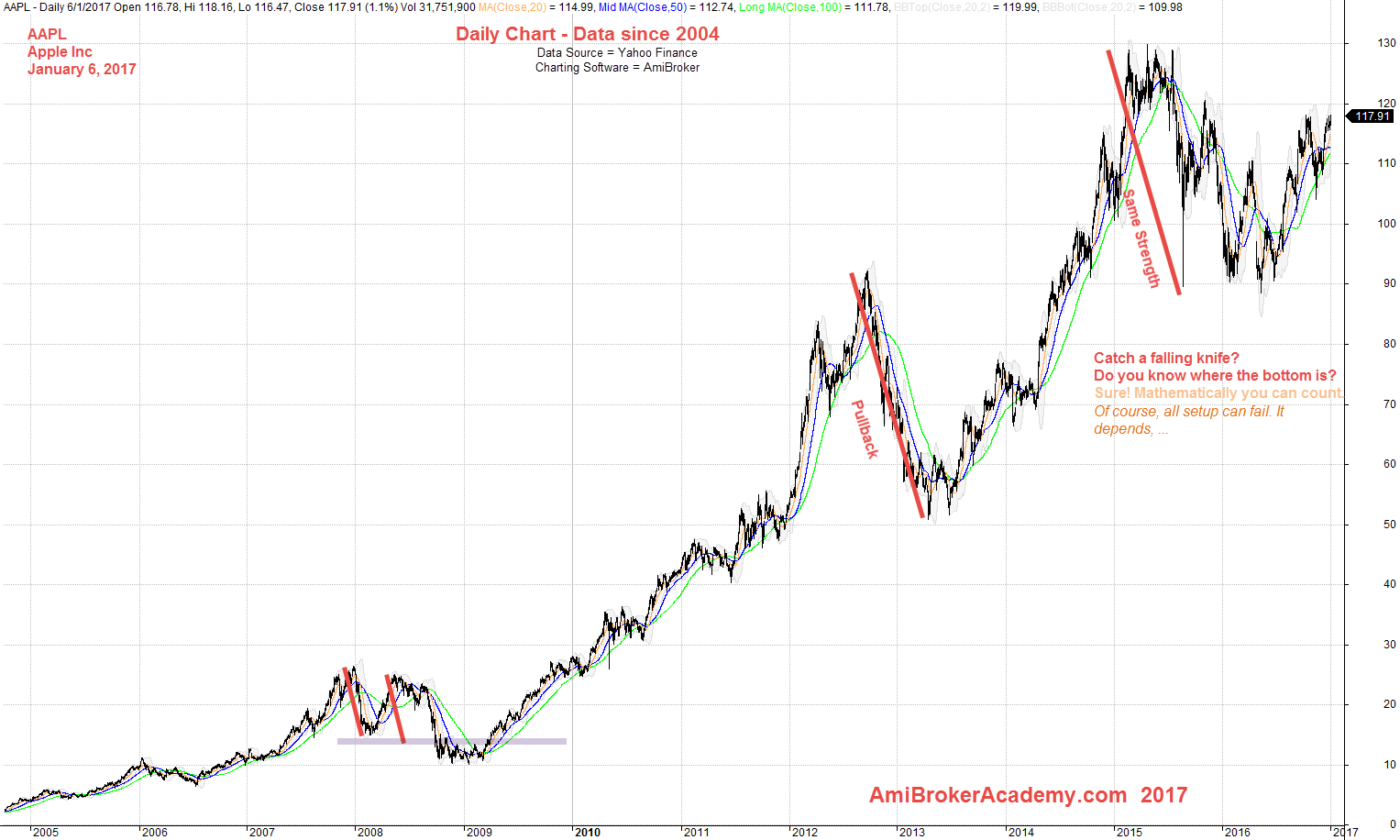
January 6, 2017 Apple Inc Daily Chart – Data Since 2004
Apple Inc Stock Price Data Since 2009
We see a double top at the recent move. Bulls and Bears are expecting the retest of the same high may fail. As bulls might be exiting the market worry the price can not travel further north. And as bears exit the market too, as they want to cut their losses. So no one want the price to move up. But when the breakout is conformed, the rally could speed up. Watch!
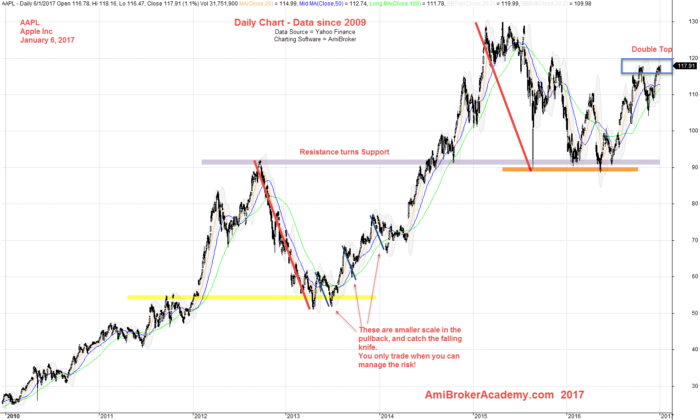
January 6, 2017 Apple Inc daily chart – data since 2009
Moses Stock Desk
AmiBrokerAcademy.com
Disclaimer:
The discussion here is for educational purposes only. All information, data, symbols and trading ideas discussed hereby are the author or authors intend to demonstrate or illustrate purposes only. These are not recommendations or advice. It is not to be construed or intended as providing trading or legal advice.
Besides that this discussion is not an offer or solicitation of any kind in any jurisdiction where any AmiBrokerAcademy.com or its affiliate is try to do business.
Please note that active trading is not suitable for everyone. Any decisions you make about your trading or investment are important to you and your family, therefore should be made in consultation with a competent financial advisor or professional. We are not financial advisor and do not claim to be one.
Any views expressed here-in are not necessarily those held by amibrokeracademy.com.