March 4, 2017
Moses Stock Trading Blog Site – AmiBrokerAcademy.com
Thank you for visiting the amibrokeracademy.com blog site. No one doing analysis like what you read here.
Welcome to Moses’s US Stock Analysis @ AmiBrokerAcademy.com.
Are you a Scalper, Swing trader or Investor?
In my rule of thumb if any trader in any time frame hole their trade for more than five bars or candles, you are a swing trader. For Swing trader hole their trade for more than ten bars or candles, they are really a investors. In any case, all are traders except different trading styles.
So, for quick profit as scalper you take your profit or lost in five or less bars in any time frame. Most of the the real scalper does it in a five minutes chart.
IBM International Business Machines Daily Charting Update
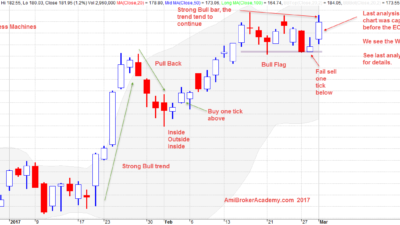
We had two postings recently for IBM, see below thumbnail. The chart was capture in the mid of March 1, in the mid of the trading day. The bar was a WIP bar. Then, we followed up on March 3, and update to that chart to complete the entire day.
See the follow up analysis to continue the March 1 bar.
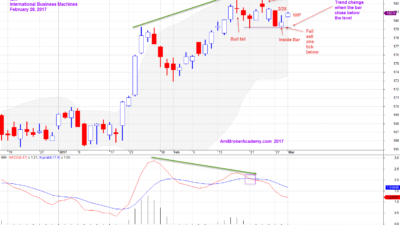
February 28, 2017 IBM Daily
March 1, 2017 IBM Daily Update
Anticipating a Bull Trend Continuation
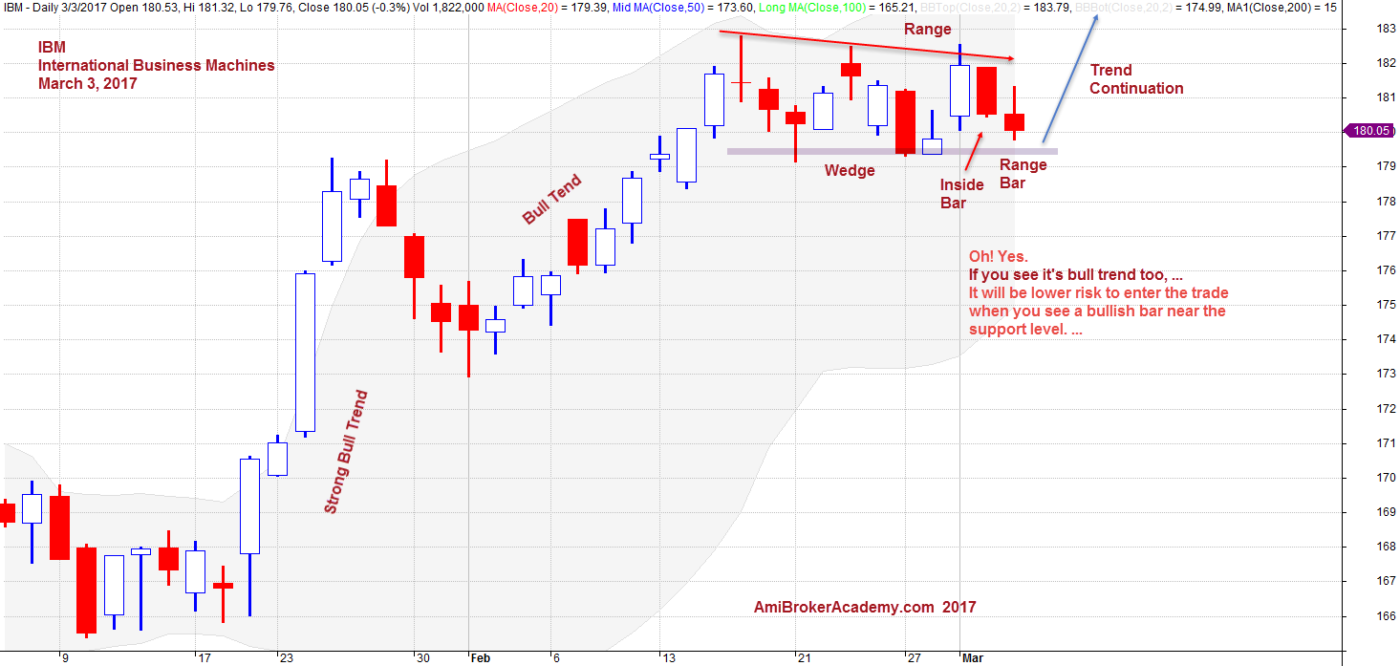
IBM International Business Machines Update on March 3, 2017
Asides from the fundamental, a strong up move after the range from mid January 2017. It follows a price pull back. We see a inside bar after the pullback low. The bull inside bar signal a trend continuation. Not as strong bull trend as the first leg up, but still a bull trend with one bear bar. After the large bull the trend exhausted; range bar, doji. Both the bull and bear are tire. Both decide to take a break.The trend starts to go sideways, in the flag. It is a bull flag, of course it can fail. We have three touch points on top and three below.
The said sideways may continue for one more up down before break out high or low. And we said also it has higher probability in high. …
But it fail, as it did not happen as we mentioned on the March 1. The trust is there is a pullback again to retest the support. Now the support is prove to be stronger. The re-bounce may happen in any time. Watch out.
Now, as said on the chart, to reduce your risk, wait a bull bar (bull bar close, in this case is the EOD bar) and buy one tick higher.
Remember, we are only sharing the experience and for the education purpose. We do not provide buy or sell signal, please seek your trade adviser for their expert advice. You are responsible for your own action. Trading is personal, even you have enter the trade at the exact same manner, you may not make money. Trading is not a get rich fast business like many have advertise. It needs a lot of hard work and good money and risk management. Have fun! Happy learning.
March 3, 2017 IBM Trend Update
If you can not see the whole chart, scales down you browser.
Moses US Stock Analysis
AmiBrokerAcademy.com
Disclaimer
The above result is for illustration purpose. It is not meant to be used for buy or sell decision. We do not recommend any particular stocks. If particular stocks of such are mentioned, they are meant as demonstration of Amibroker as a powerful charting software and MACD. Amibroker can program to scan the stocks for buy and sell signals.
These are script generated signals. Not all scan results are shown here. The MACD signal should use with price action. Users must understand what MACD and price action are all about before using them. If necessary you should attend a course to learn more on Technical Analysis (TA) and Moving Average Convergence Divergence, MACD.
Once again, the website does not guarantee any results or investment return based on the information and instruction you have read here. It should be used as learning aids only and if you decide to trade real money, all trading decision should be your own.