November 1, 2016

Image from Internet – Roller Coaster
Don’t Say We Did Warn You
Either you take profit and stay aside and watch or prepare yourself to ride the US’ roller coaster for the next thirty days. So, have fun!
The chart will be somewhat interesting for the next thirty days, worldwide. Starting from the US market, followed by Asia and the rest of the world. This is also expected by many.
The US market this week and likely into the US Presidential Election, let’s called it UPE will let the markets. The markets is going to do one of the three things, up, down of sideways. It should be volatile otherwise the people are really don’t care. Hmm!
There’s no way to avoid the political impact on the markets. The markets are a political position right now, especially U.S. data and stock market.
You probably are very sick of the political play by some of speeches of some of the people, the rate hike. Months after month and talking. The rate comes after election now. One thing for sure, the speech powerful. Each speech will swing the market in either direction. To decode, we should go to their formal school so we can read the market better. Follow their teachers.
3rd Quarter, U.S. GDP suggests that there are reasons for the FOMC to continue to hold rates. This would increase December hike expectations.
We Are AmiBroker enthusiast
Just in case you do not know, we are not AmiBroker. We are just AmiBroker enthusiasst.
For those want to learn more about AmiBroker, check their official site at www.amibroker.com for more.
AmiBroker a Powerful Charting Tool
If you have a tool like AmiBroker, you can zoom in and out to look at a ticket in many way. Example, daily, weekly, or monthly chart. You can view all the data you have for that particular ticket. We just zoom out to see Apple since 2012. We see resistance turn support. We see resistance continue to be resistance again. We can see ‘risky’ buy or sell.
AAPL | Apple Inc Weekly Data From 2012
Is the price already park at the resistance for November 8? Will see. Picture worth a thousand words, have fun!
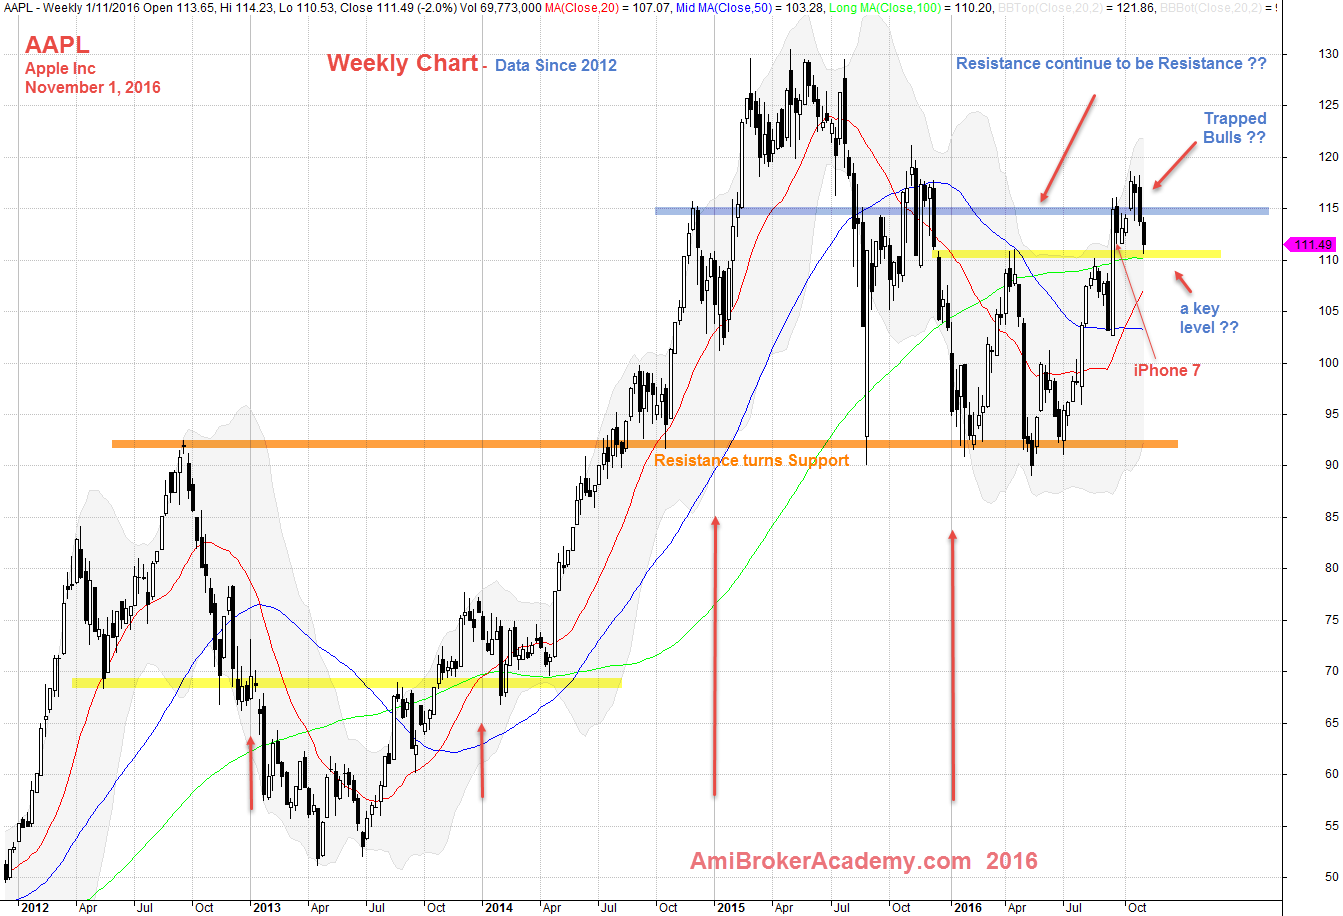
November 1, 2016 Apple Inc Weekly Data From 2012
When you like to see what the indicator has to say, just flip to the sheet with your favourite
AmiBroker by default provides you with eight (8) sheets of chart, you could set them up with you favourite indicators. I have one with MACD indicators and Moving Averages. See chart below.
AAPL | Apple Inc Weekly and MACD Data From 2012
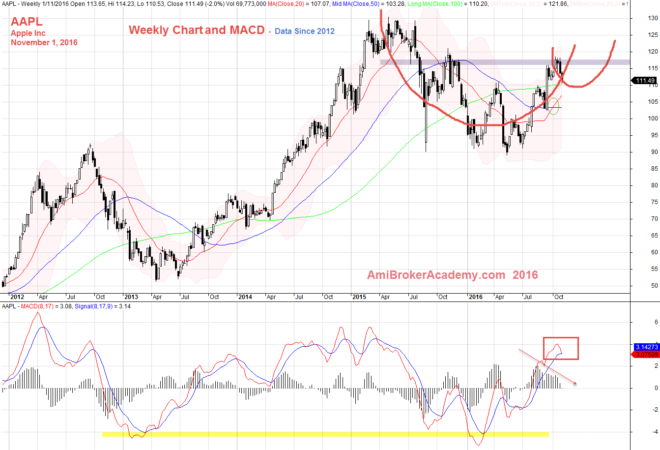
November 1, 2016 Apple Inc and MACD from 2012
Have fun!
Moses US Stock Desk
AmiBrokerAcademy.com
Disclaimer:
The discussion here is for educational purposes only. All information, data, symbols and trading ideas discussed by the author or authors are for demonstration or illustration purposes only and are not recommendations. It is not to be construed or intended as providing trading or legal advice.
This discussion is not an offer or solicitation of any kind in any jurisdiction where any AmiBrokerAcademy.com or its affiliate is try to do business.
Please note that active trading is not suitable for everyone. Decisions you make about your trading or investment are important to you and your family, therefore should be made in consultation with a competent financial advisor or professional. We are not financial advisor and do not claim to be.
Any views expressed here-in are not necessarily those held by amibrokeracademy.com.
We do not represent the external reference, or reference. We can not be responsible for their views and site availability.