February 2, 2018
No Right No Wrong
Let’s zoom in, and see the correlation one more time, see the last ten months Twitter Inc and Facebook Inc stock price correlation.
US Stock Analysis
TWTR Twitter Inc and FB Facebook Inc Correlation in Last Ten Months
See chart, we have study the stocks correlation from 2015. Now let’s zoom in and study the correlation for the last ten months. What have you found? Both stocks seem to move in the same trend, bullish.
Powerful Chart Software – AmiBroker
The following chart is produced using AmiBroker charting software. It is a powerful chart software. You plot the stocks you are interested all in one chart, as long as you still could read them. See chart below.
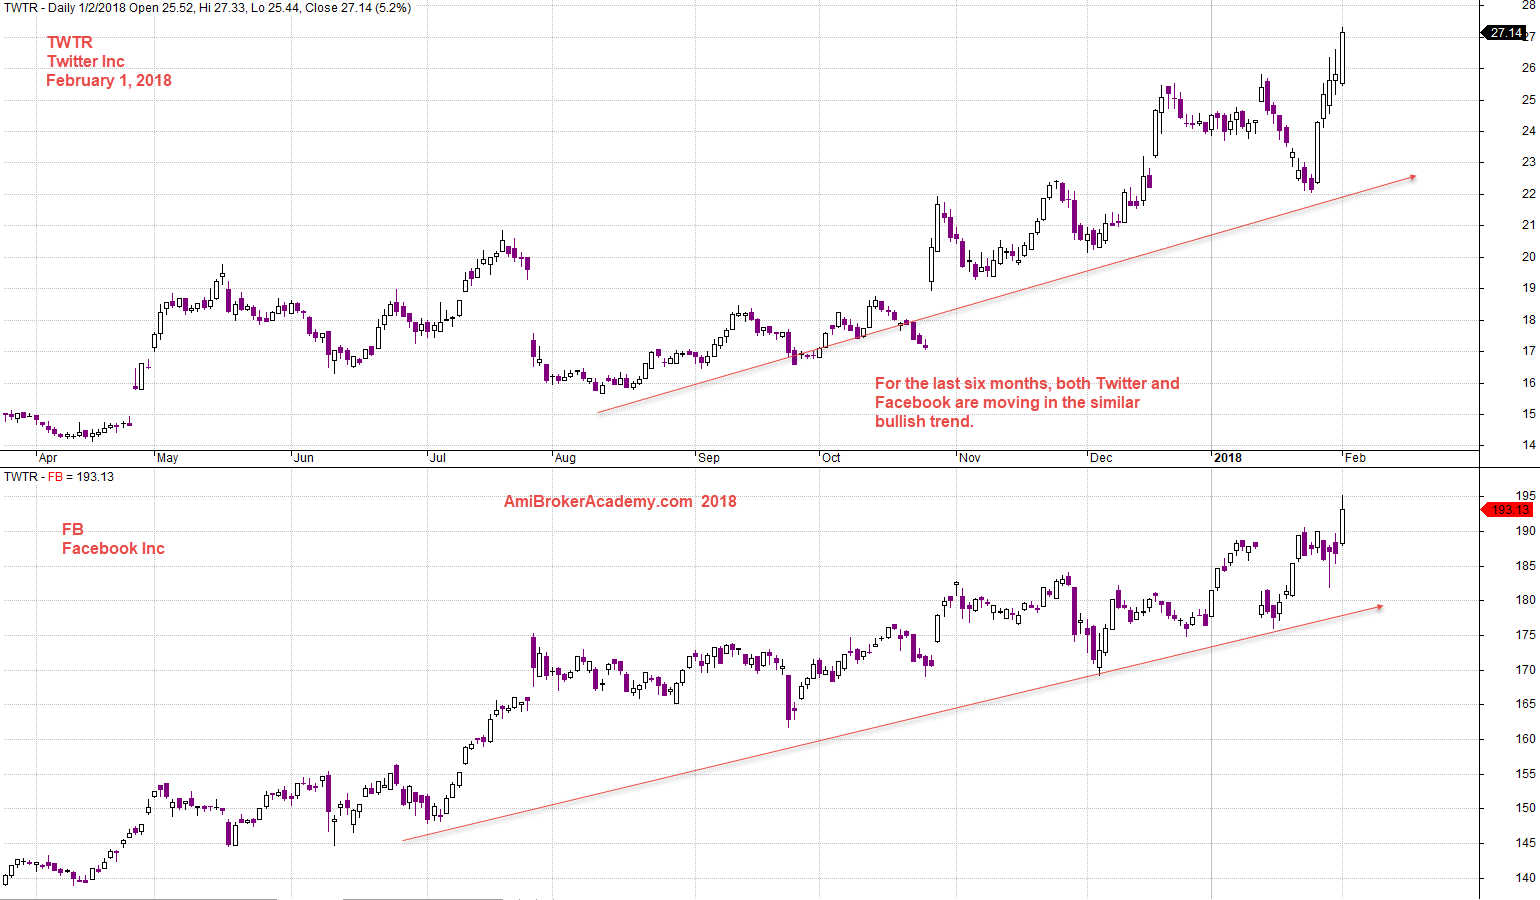
February 1, 2018 Twitter Inc and Facebook Inc Last Ten Months Stock Price Correlation
Moses
AmiBrokerAcademy.com
Disclaimer
The above result is for illustration purpose. It is not meant to be used for buy or sell decision. We do not recommend any particular stocks. If particular stocks of such are mentioned, they are meant as demonstration of Amibroker as a powerful charting software and MACD. Amibroker can program to scan the stocks for buy and sell signals.
These are script generated signals. Not all scan results are shown here. The MACD signal should use with price action. Users must understand what MACD and price action are all about before using them. If necessary you should attend a course to learn more on Technical Analysis (TA) and Moving Average Convergence Divergence, MACD.
Once again, the website does not guarantee any results or investment return based on the information and instruction you have read here. It should be used as learning aids only and if you decide to trade real money, all trading decision should be your own.