August 31, 2017
Let’s study Singtel share price using MACD. What’s MACD signals can you find so far? Have fun!
Z74 Singtel and MACD Signal
We can easily see price keeps forming higher high, but the MACD Histogram just forming lower high. May be the bull is weaker, and the bull trend is ending. This is when you assess the MACD signals.
True or true. The result was correct. The next thing is the price just keep forming lower high. So, don’t play play (Singlish) with the MACD indicator. Trade carefully.
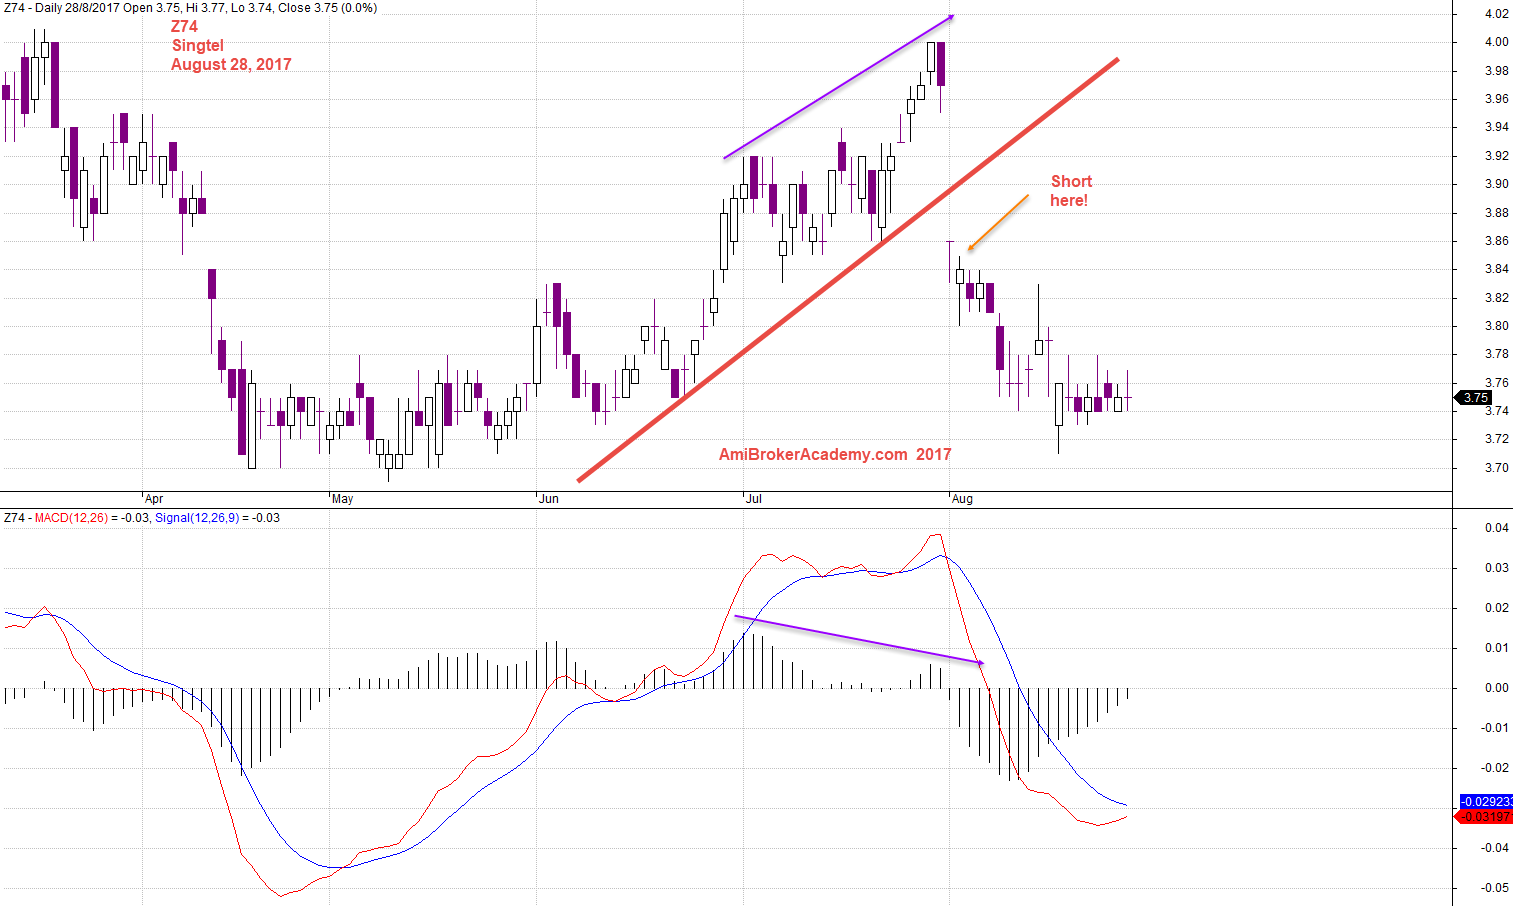
August 28, 2017 Singtel and MACD Signal
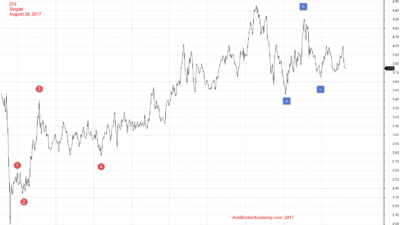
August 28, 2017 Singtel Weekly Line Chart and Wave Count
Z74 Singtel Line Chart and Wave Count
If you can not see the trend, or wave count. Change to line chart, you could see better. If you try to map it to Elliott Wave, see chart below to see the mapping.
Thanks for visit the site here. You could also find free MACD scan here in this site too.
Moses
AmiBrokerAcademy.com
Disclaimer
The above result is for illustration purpose. It is not meant to be used for buy or sell decision. We do not recommend any particular stocks. If particular stocks of such are mentioned, they are meant as demonstration of Amibroker as a powerful charting software and MACD. Amibroker can program to scan the stocks for buy and sell signals.
These are script generated signals. Not all scan results are shown here. The MACD signal should use with price action. Users must understand what MACD and price action are all about before using them. If necessary you should attend a course to learn more on Technical Analysis (TA) and Moving Average Convergence Divergence, MACD.
Once again, the website does not guarantee any results or investment return based on the information and instruction you have read here. It should be used as learning aids only and if you decide to trade real money, all trading decision should be your own.