December 7, 2016
Moses Stock Analysis – ^XAU
^XAU | PHLX Gold/Silver Sector Index
This is a further update from the last posting. We look at the Gold/Silver Sector Index chart from a different angle. Okay?
From the chart, you can see the price action is below 34 EMA wave, so look for opportunity to short as the market still bearish. Where to short? 34 EMA Wave is an optima zone. So if can trigger near the optima zone! It will be even better if can find a resistance, a bearish candlestick pattern. Have fun!
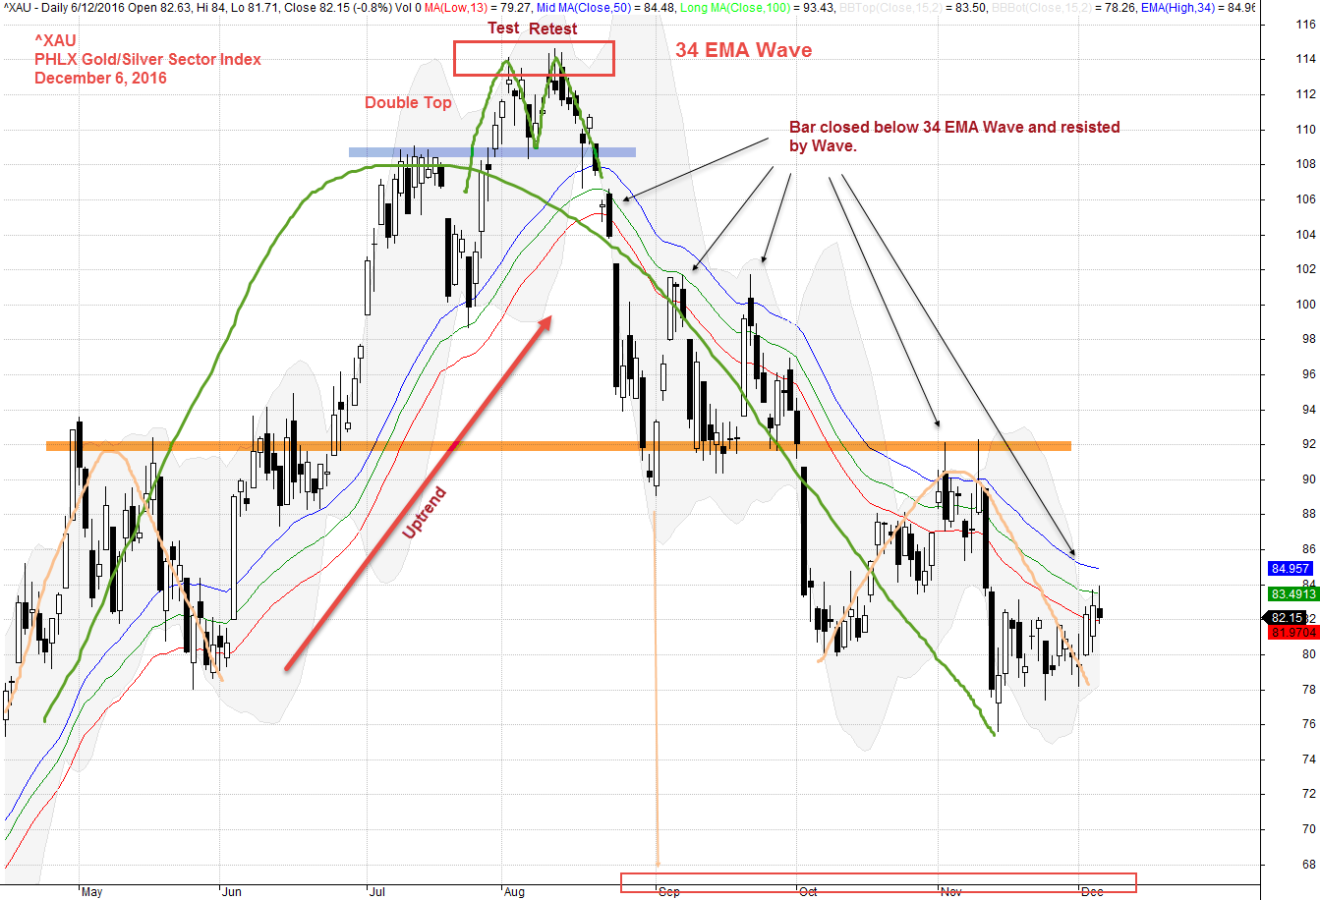
December 6, 2016 Phlx Gold/Silver Sector Index Chart
Moses Stock Desk
AmiBrokerAcademy.com
Disclaimer:
The discussion here is for educational purposes only. All information, data, symbols and trading ideas discussed hereby are the author or authors intend to demonstrate or illustrate purposes only. These are not recommendations or advice. It is not to be construed or intended as providing trading or legal advice.
Besides that this discussion is not an offer or solicitation of any kind in any jurisdiction where any AmiBrokerAcademy.com or its affiliate is try to do business.
Please note that active trading is not suitable for everyone. Any decisions you make about your trading or investment are important to you and your family, therefore should be made in consultation with a competent financial advisor or professional. We are not financial advisor and do not claim to be one.
Any views expressed here-in are not necessarily those held by amibrokeracademy.com.