August 24, 2017
In the earlier posting, we share with you what we see MACD signal of Stock X. Let see the stock chart in other expect. Enjoy your learning.
X United States Steel Corp and MACD Signals
See chart for more, picture worth a thousand words.
Share price forms higher high, MACD signal forms lower high, divergence.
Connect the low and draw a trendline, we expect the price to breakout below the trendline. But you have to remember and always believe, all setup can fail. The setup did not fail. Have fun!
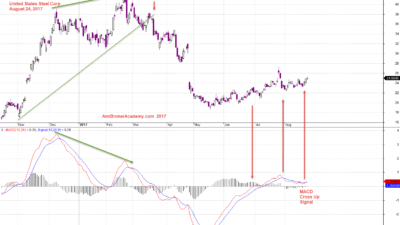
August 24, 2017 United States Steel Corp and MACD Signals
X United States Steel Corp and Support Resistance
Picture worth a thousand words. See chart for more.
Can you see the important level, support resistance? The level that plays an important role for this stock. When the price continue to stay below the resistance. those that ran across the resistance is being trapped.
With the Support Resistance Level drawn, can you see a nice head and shoulders in progress.
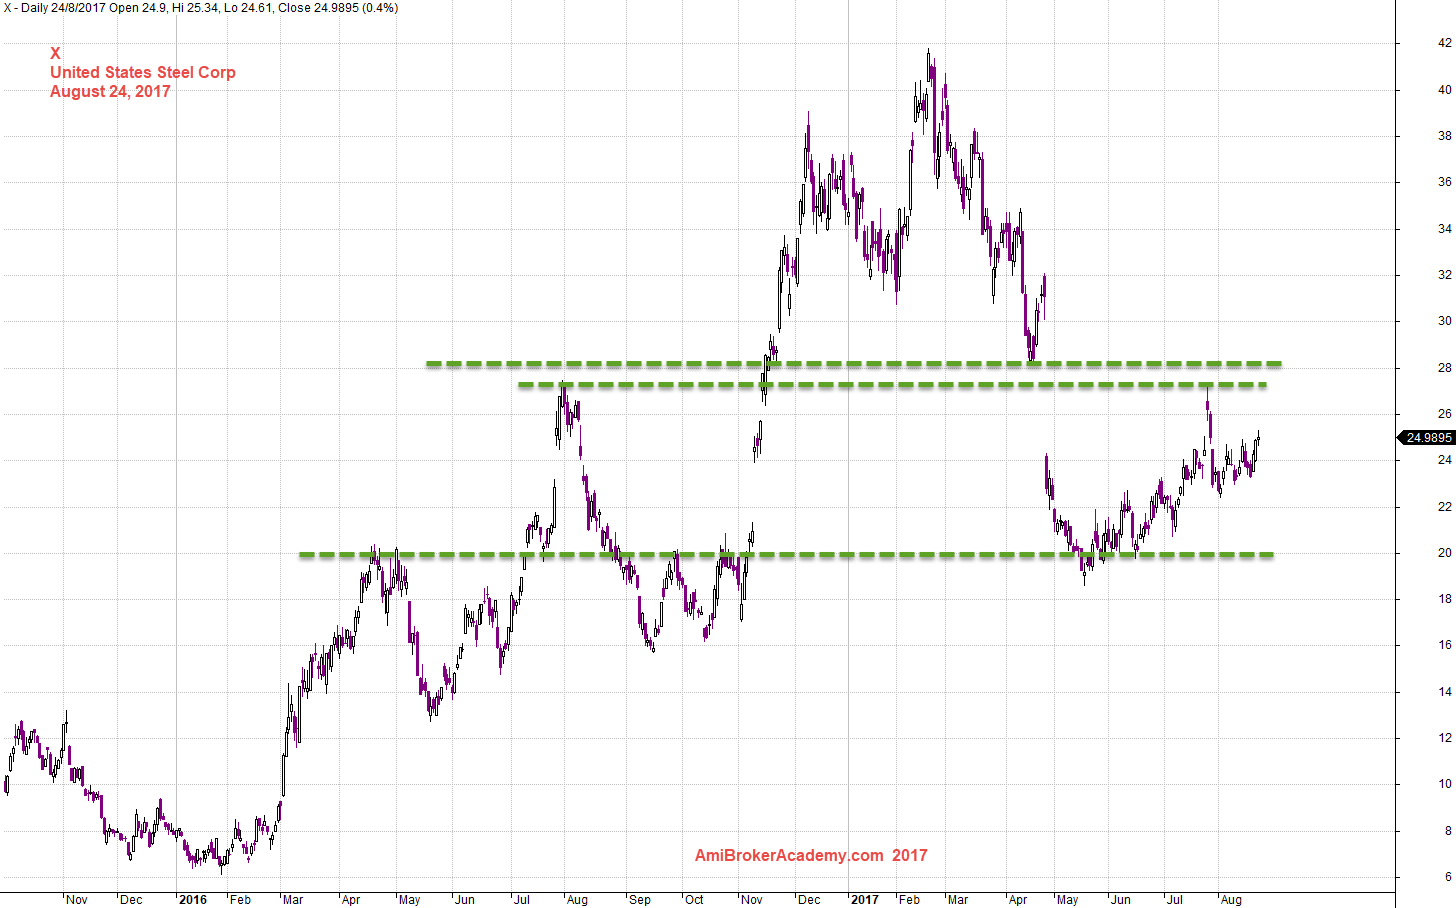
August 24, 2017 United States Steel Corp and Support Resistance
X United States Steel Corp and Channel
Connect the low, draw the trendline. Copy and paste the trendline and forms the channel.
The price trap in the channel, and breakout above the channel. The price action moves layer by layer.
Picture worth a thousand words, see chart for more.
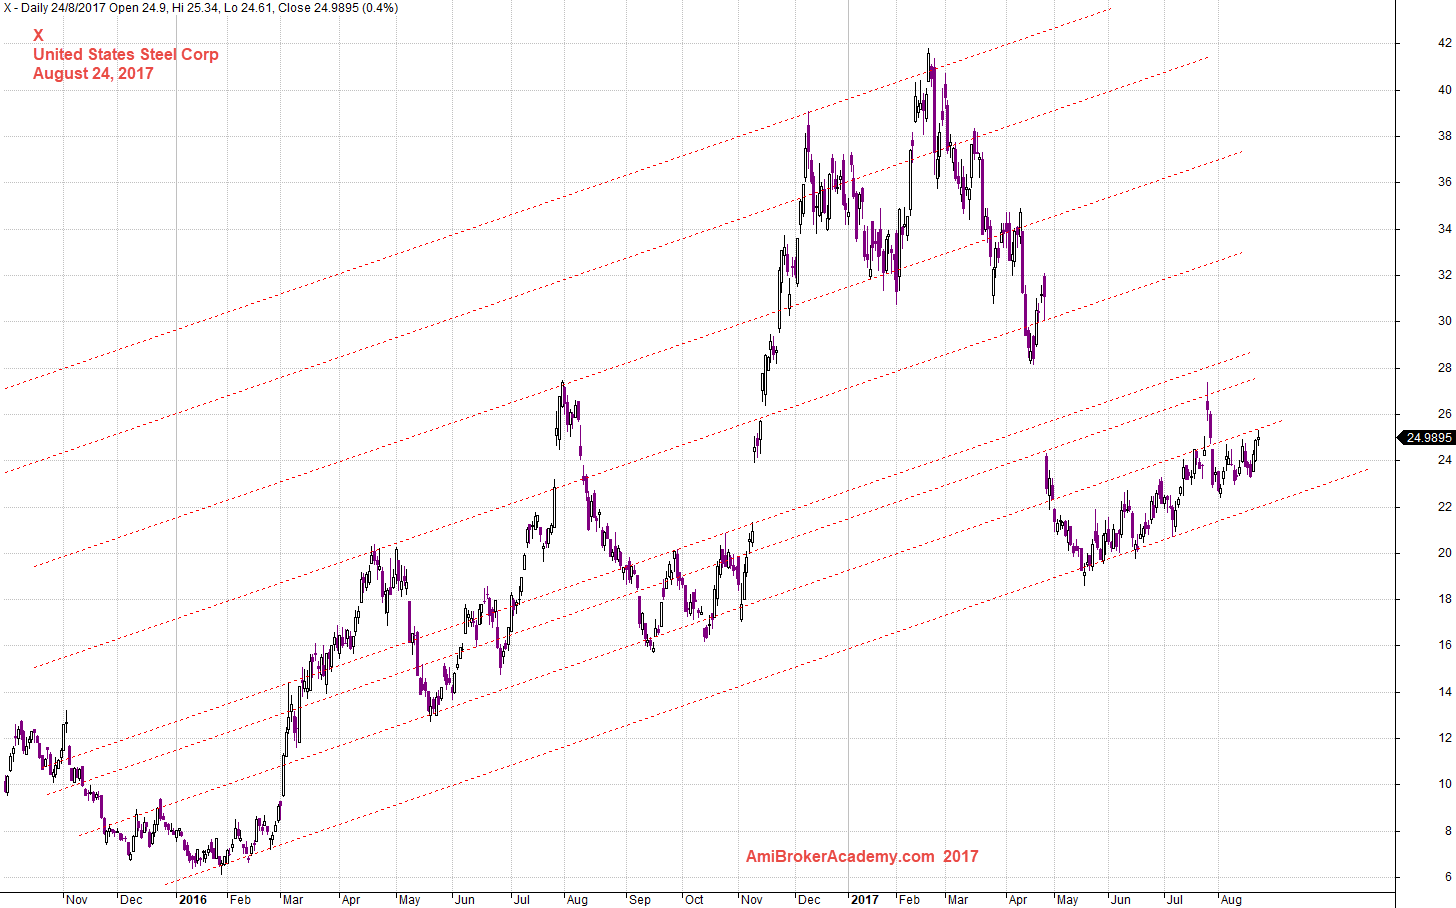
August 24, 2017 United States Steel Corp and Channel
X United States Steel Corp and 34 MA Band
The price action finally crosses above the MA, the 34 MA band. Bullish.
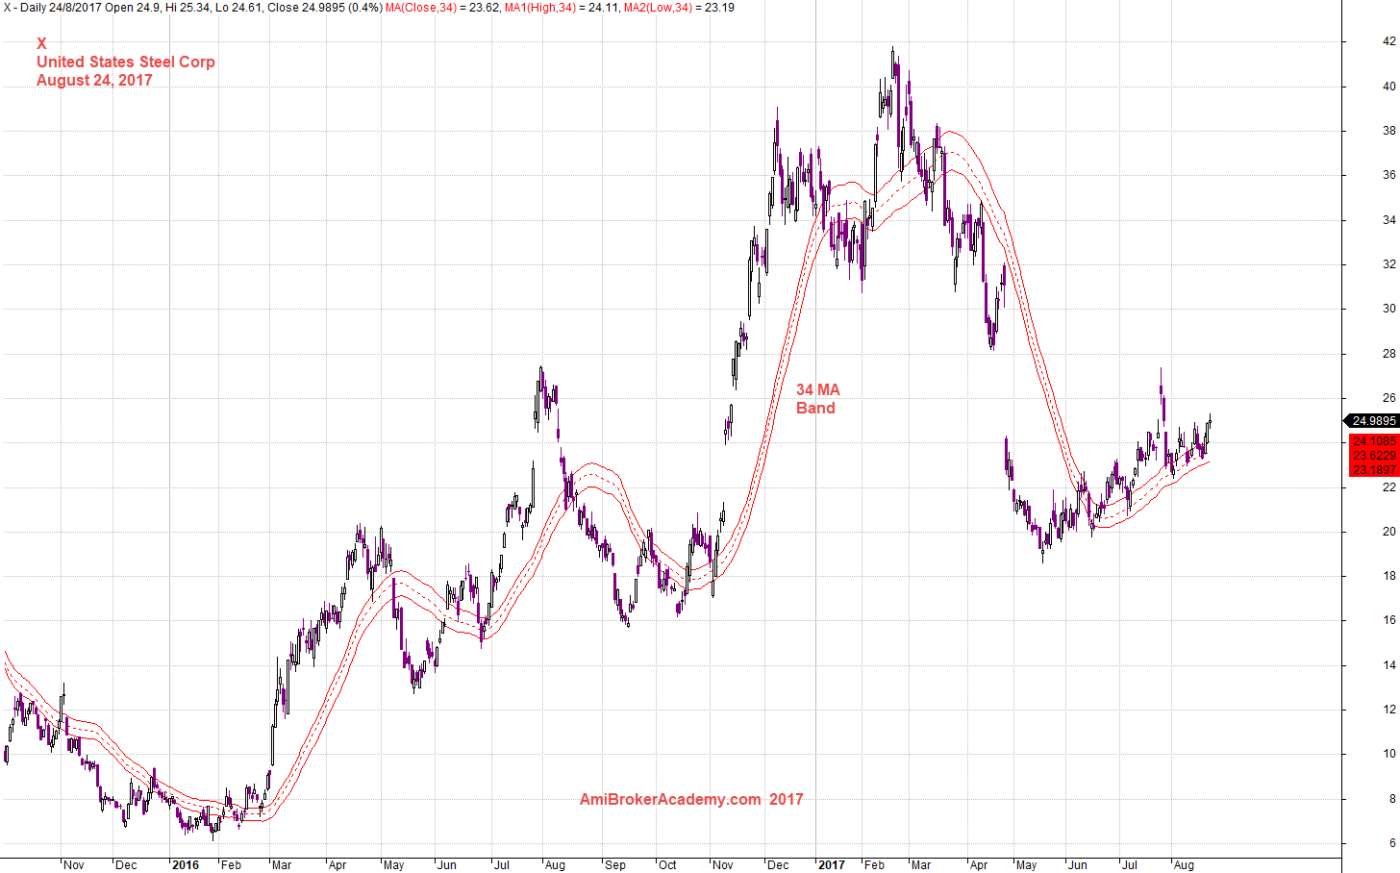
August 24, 2017 United States Steel Corp and 34 MA Band
Thanks for visit the site here. You could also find free MACD scan here in this site too.
Moses
AmiBrokerAcademy.com
Disclaimer
The above result is for illustration purpose. It is not meant to be used for buy or sell decision. We do not recommend any particular stocks. If particular stocks of such are mentioned, they are meant as demonstration of Amibroker as a powerful charting software and MACD. Amibroker can program to scan the stocks for buy and sell signals.
These are script generated signals. Not all scan results are shown here. The MACD signal should use with price action. Users must understand what MACD and price action are all about before using them. If necessary you should attend a course to learn more on Technical Analysis (TA) and Moving Average Convergence Divergence, MACD.
Once again, the website does not guarantee any results or investment return based on the information and instruction you have read here. It should be used as learning aids only and if you decide to trade real money, all trading decision should be your own.