January 13, 2018
The Worst Trade Will Be a Trapped Move See Example on NUS stock
US Stock Analysis
NUS Nu Skin Enterprises Inc Year High Low from 2008
See chart from the boxes analysis, it can be easily spotted a trapped move. See example below using Nu Skin stock chart. Year 2013 and 2014 seems to be a good year for Nu Skin stock, but for those believe they miss the opportunity a rush in will just fall in the trapped. So, do not listen to your consultant and the believe the company is doing well. As an investor or trader do your home work by reading the chart. When the stock price breakout the resistance and move so high in a short time, the risk rewards ratio become very little to take advantage. It is a good idea to stand aside to watch the development. Everything that goes up will finally comes down. See the “holy grail rule of thumb” always come true.
Those whom caught in the trapped during 2013 and 2014 will take many years to recover, or never recover at all. Remember to buy support and sell resistance another holy grail rule of thumb. However, it is most difficult to catch.
Nu Skin is a MLM organisation have many many products distribute through multilevel.
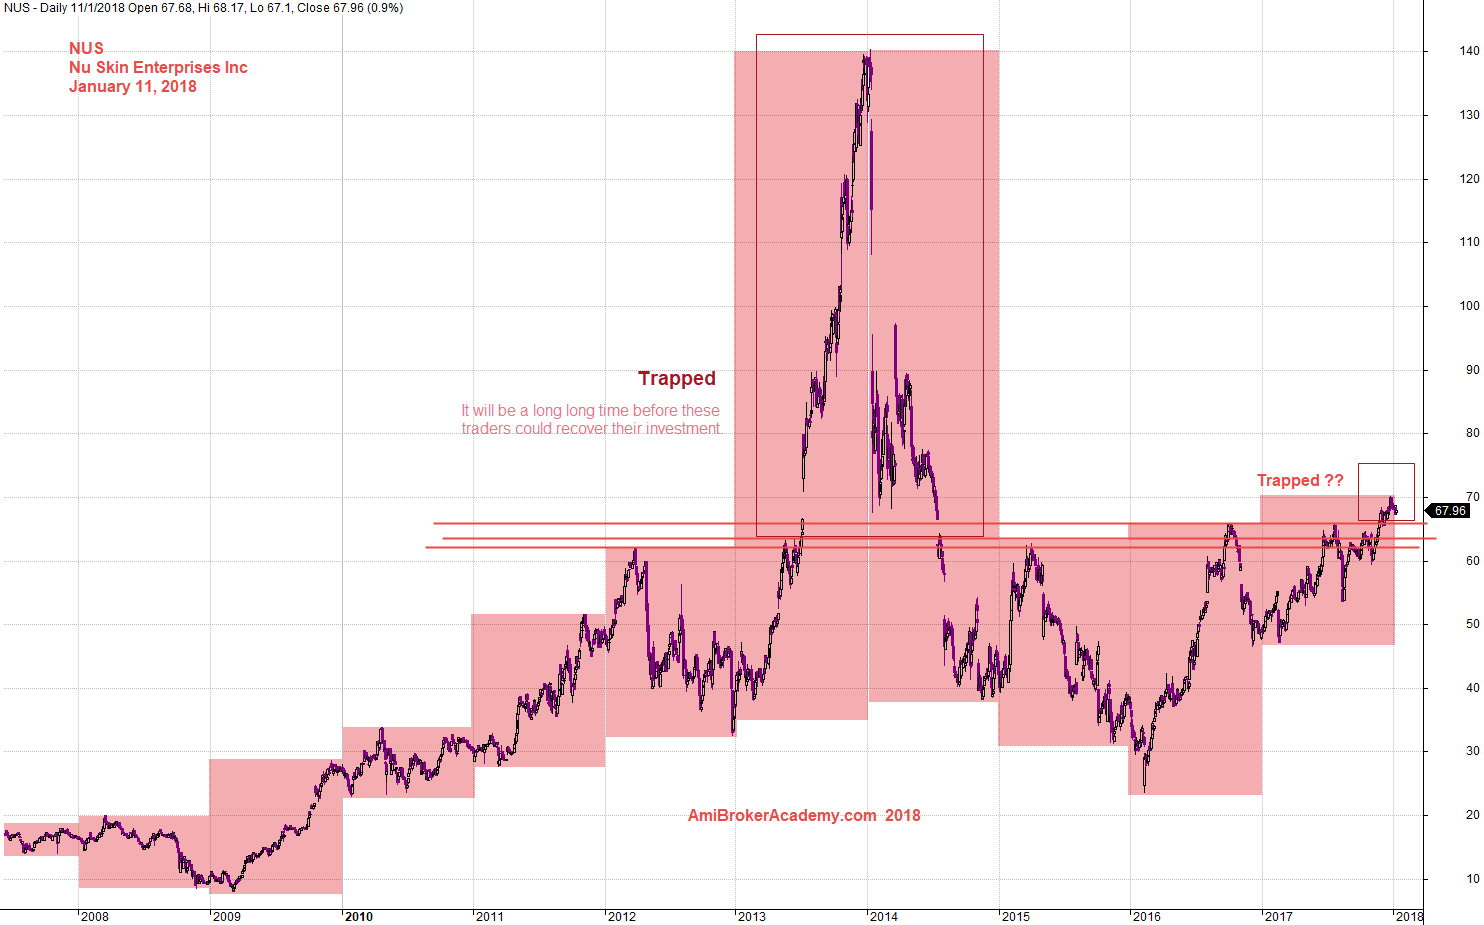
January 11, 2018 Nu Skin Enterprises Inc Year High Low and Trapped
Powerful Chart Software – AmiBroker
The following chart is produced using AmiBroker charting software. It is a powerful chart software. You plot the stocks you are interested all in one chart, as long as you still could read them. See chart below.
Moses
AmiBrokerAcademy.com
Disclaimer
The above result is for illustration purpose. It is not meant to be used for buy or sell decision. We do not recommend any particular stocks. If particular stocks of such are mentioned, they are meant as demonstration of Amibroker as a powerful charting software and MACD. Amibroker can program to scan the stocks for buy and sell signals.
These are script generated signals. Not all scan results are shown here. The MACD signal should use with price action. Users must understand what MACD and price action are all about before using them. If necessary you should attend a course to learn more on Technical Analysis (TA) and Moving Average Convergence Divergence, MACD.
Once again, the website does not guarantee any results or investment return based on the information and instruction you have read here. It should be used as learning aids only and if you decide to trade real money, all trading decision should be your own.