What is next? Uptrend or Downtrend in 2012? Who has the crystal ball that could read into the next year Singapore stock market?
The Singapore economy forecast has been revising down for the last few months. Plus Straits Times Index, the Singapore stock market benchmark has been falling from the high of 3263 points to the low 2659 points (round number).
Last night, the market closed at 2672.78 points, 6.55 points higher than the last market closed.
However, the fact is there has been a drop of 600 points for the whole 2011. So, is the market continuing to heading south (downtrend) or just a pull back before and leap up?
Market is always moving in a zigzag manner. Whether the market is up or down, there is always have the same number of buyers and sellers. These are willing buyers and willing sellers. There are always people laughing to the bank (making money) of course there are people making loses.
Someone shares that the stock market index is always a leading indicator for the economy. The stock index will start to show a slow down, sideways before the economy starts to experience the recession.
Now the STI has hit the critical support level, if it does not support the index that will give crude to next year economy. Is it true? Will see? Anyway, hope the rebound can be successful so we will have a good economy for 2012.
Technical Analysis
See the Technical Analysis on the Straits Times Index 24 years Weekly charts and 5 years daily chart. These are different dimensions of finding the meaning of the index and the possible future market like. The TA is both the science and art. The science has showed you what has happened and what may happen. The art is the execution; the human being that help to complete the picture.
As said, whether the trend is up or down, there will still have people making money and losing money. So manage your risk and trade with your eyes open. Trade what you see and not what you think (or the market think.) Be careful the news is always old; it is a report of what had happened.
Happy New Year! Wishing you and your loved ones a healthy, wealthy, joyful and rewarding 2012 ahead.
Straits Times Index, STI 24 Years Weekly Chart
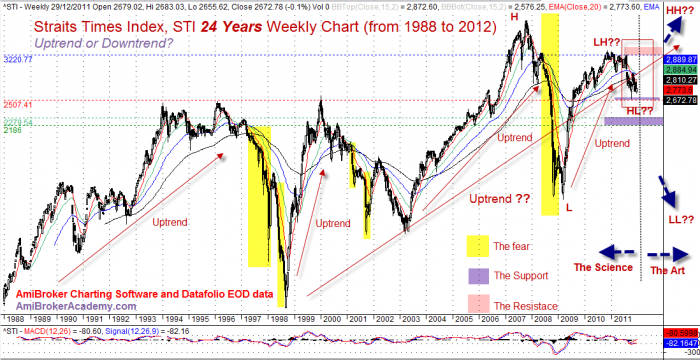
Straits Times Index 24 Years Weekly Chart (1988 - 2011)
Straits Times Index, STI 24 Years Weekly Chart and Gartley Trading Method AB=CD pattern
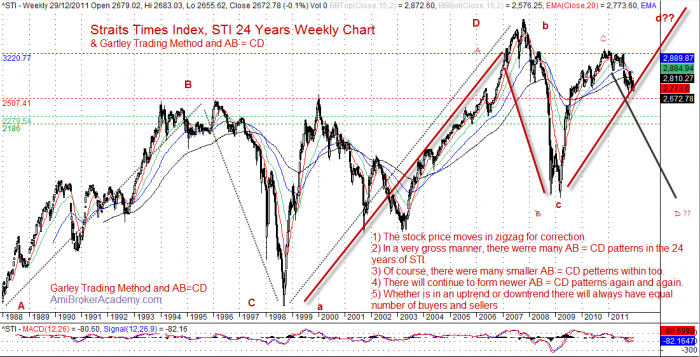
Straits Times Index, STI 24 YearsWeekly Chart and Gartley Trading Method
Straits Times Index, STI 5 Years Daily Chart
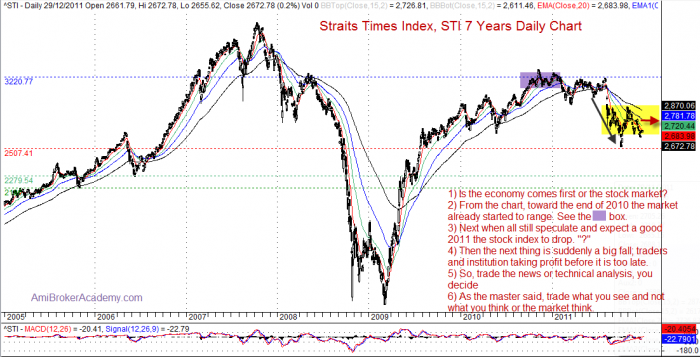
Straits Times Index, STI 7 Years Daily Chart (2005 to 2011)
DSICLAIMER
Information provided here is of the nature of a general comment only and no intend to be specific for trading advice. It has prepared without regard to any particular investment objectives, financial situation or needs. Information should not be considered as an offer or enticement to buy, sell or trade.
You should seek advice from your broker, or licensed investment advisor, before taking any action.
Once again, the website does not guarantee any results or investment return based on the information and instruction you have read here. It should be used as learning aids only and if you decide to trade real money, all trading decision should be your own.
Leave a Reply
You must be logged in to post a comment.