19 October 2016
AAPL Apple Inc Six Months Data and Wave Daily
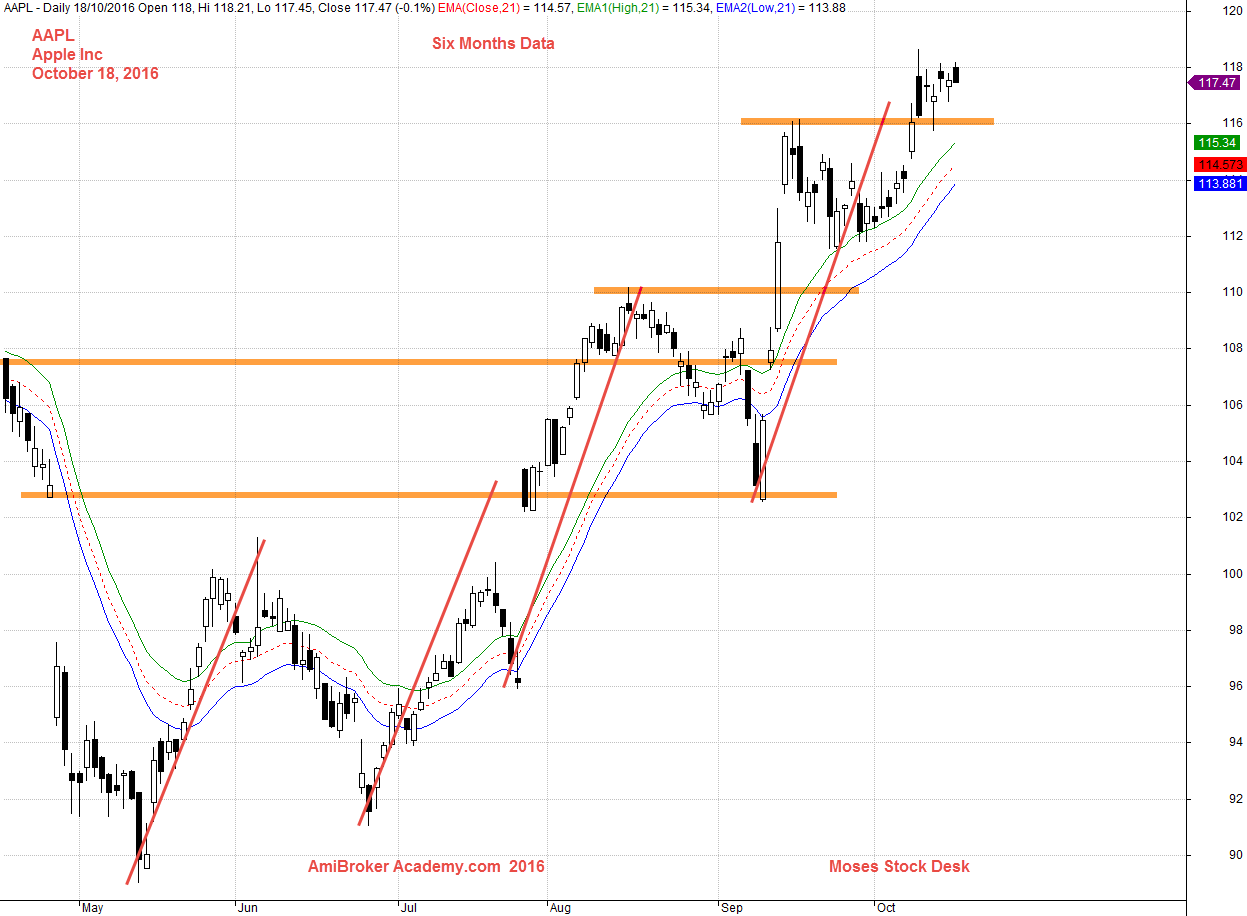
October 18, 2016 Apple Inc and Wave Six Months Chart
AAPL Apple Inc Three Months Data and Wave Daily
If price action can not break out the last high, is bearish. The wave is point between twelve and two o’clock. It is bullish bias.
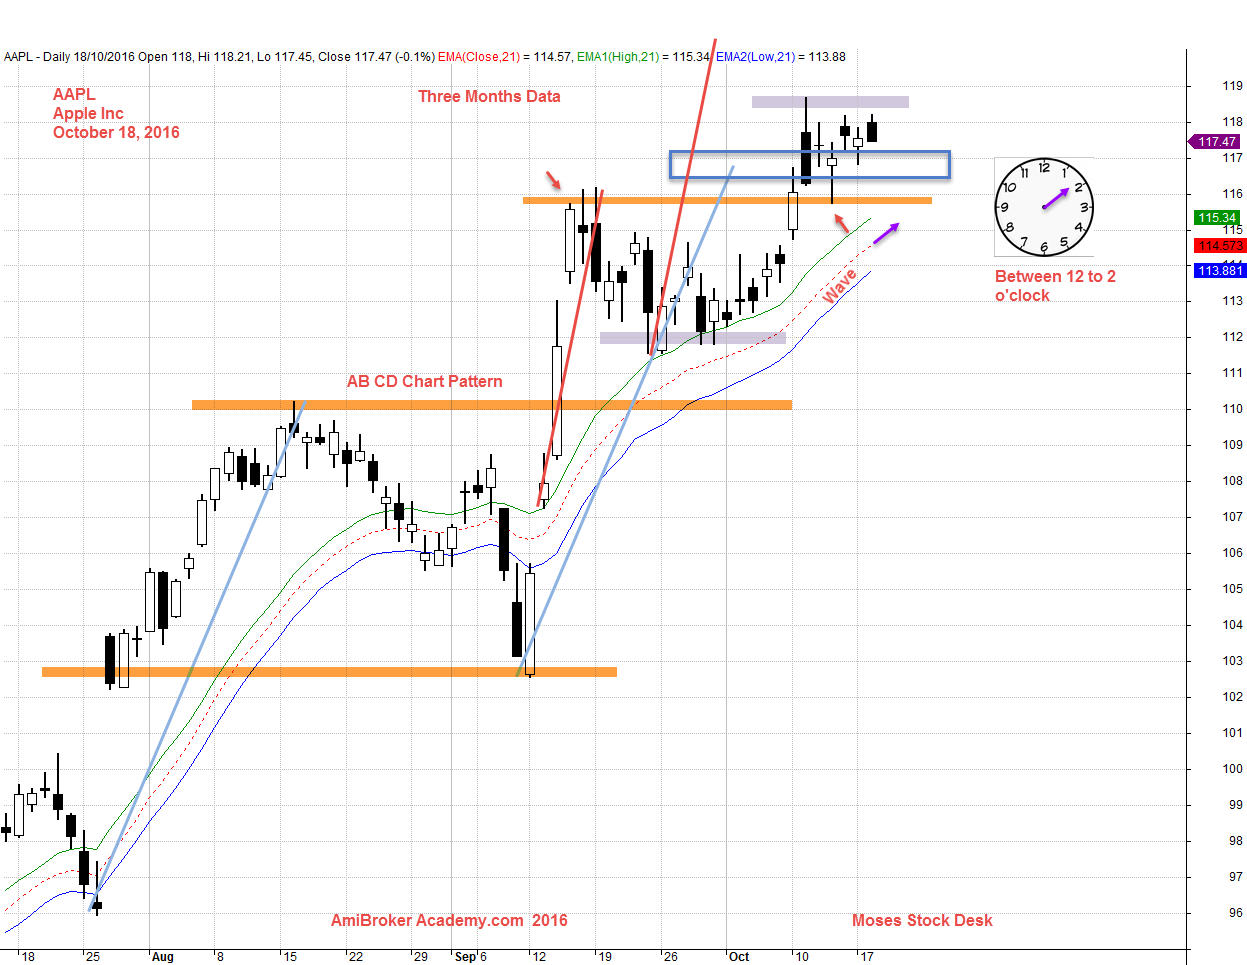
October 18, 2016 Apple Inc Three Months Data and Wave
Have fun!
Moses US Stock Desk
AmiBrokerAcademy.com
Disclaimer: All information, data and material contained, presented, or provided on amibrokeracademy.com is for educational purposes only. It is not to be construed or intended as providing trading or legal advice. Decisions you make about your trading or investment are important to you and your family, therefore should be made in consultation with a competent financial advisor or professional. We are not financial advisor and do not claim to be. Any views expressed here-in are not necessarily those held by amibrokeracademy.com. You are responsible for your trade decision and wealth being.