May 10, 2017
^VIX Volatility S&P 500 Index Charting and Support Resistance
Will the index retest the resistance zone? Will see. This chart is taken out from folder, do not think it was posted.
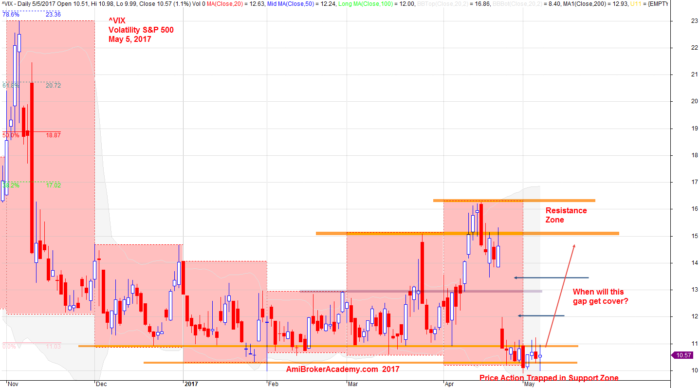
May 5, 2017 Volatility S&P 500 and Support Resistance and Gap
^VIX Volatility S&P 500 Index Charting and Moving Average
See chart, you can easily find ^VIX try to retest the low and start to breakout below the support.
Five months low. When ^VIX breakout lower. it would be a very strong one.
This chart is taken out from folder, do not think it was posted.
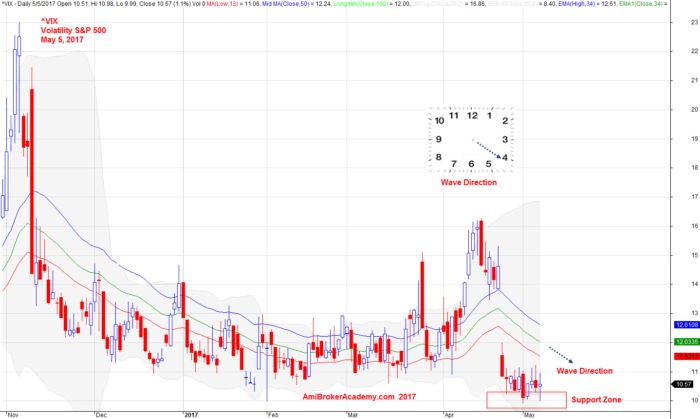
May 5, 2017 Volatility S&P 500 and 34 EMA Wave Direction
^VIX Volatility S&P 500 Index Charting and MACD Indicator
VIX has broken out lower compare with the chart above.
MACD indicator has a MACD cross down signal. MACD indicator has MACD divergence. Picture worth a thousand words. ^VIX has broken out lower, but the divergence indicates trend ending. So, which is which? Wait one more day, let the price action show hands.
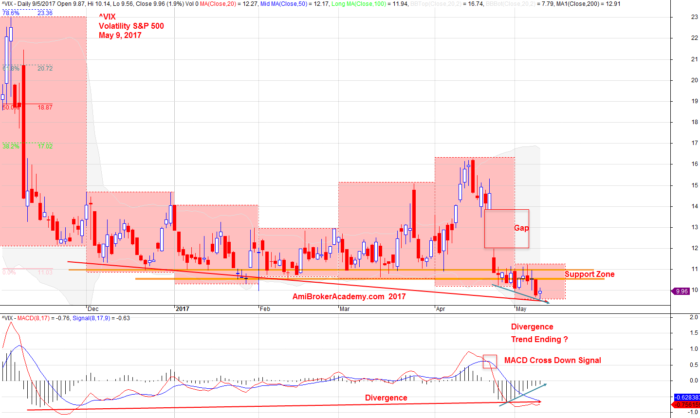
May 9, 2017 Volatility S&P 500 and MACD Divergence
Think Think (Things) Got More Things
^VIX Volatility S&P 500 Index and Support Resistance and Gap
See chart below, the price action breakout lower. But we see a Doji candle, so VIX is in indecision. Wait One More Day to see what the traders think.
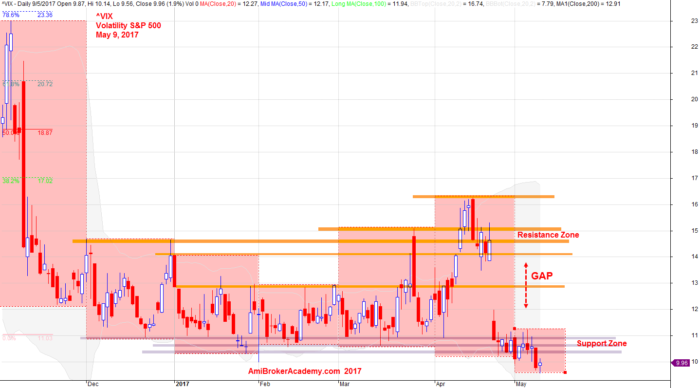
May 9, 2017 Volatility S&P 500 and Support Resistance and Gap
^VIX Volatility S&P 500 Index Benchmark NASDAQ Index
See the two index, there is a divergence from the chart. Let’s monitor the indexes and see is there any correlation? Happy learning.
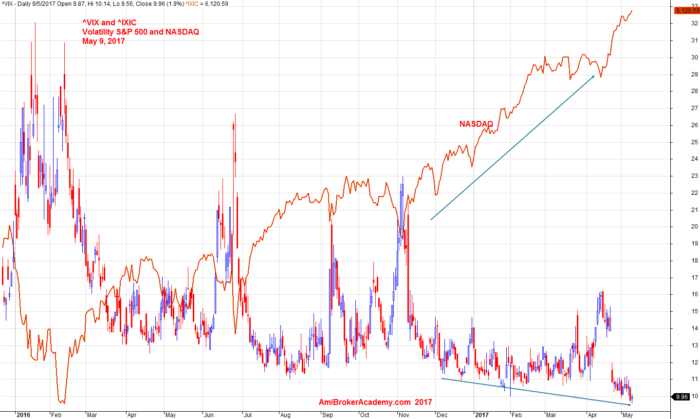
May 9, 2017 Volatity S&P 500 benchmark NASDAQ Index
The analysis here is intended to be a tutorial only. We look at the chart from different views. We mainly study the popular stocks in US market and Singapore. Hope you can learn something. There is no right no wrong.
Moses Stock Analysis
AmiBrokerAcademy.com
Disclaimer
The above result is for illustration purpose. It is not meant to be used for buy or sell decision. We do not recommend any particular stocks. If particular stocks of such are mentioned, they are meant as demonstration of Amibroker as a powerful charting software and MACD. Amibroker can program to scan the stocks for buy and sell signals.
These are script generated signals. Not all scan results are shown here. The MACD signal should use with price action. Users must understand what MACD and price action are all about before using them. If necessary you should attend a course to learn more on Technical Analysis (TA) and Moving Average Convergence Divergence, MACD.
Once again, the website does not guarantee any results or investment return based on the information and instruction you have read here. It should be used as learning aids only and if you decide to trade real money, all trading decision should be your own.