July 13, 2017
Be Happy!
The more that you trade, the more dense the darkness of your delusion becomes. Why? Look around, you see kids are happy, worry less, … and experience adult are not …
Be Happy!
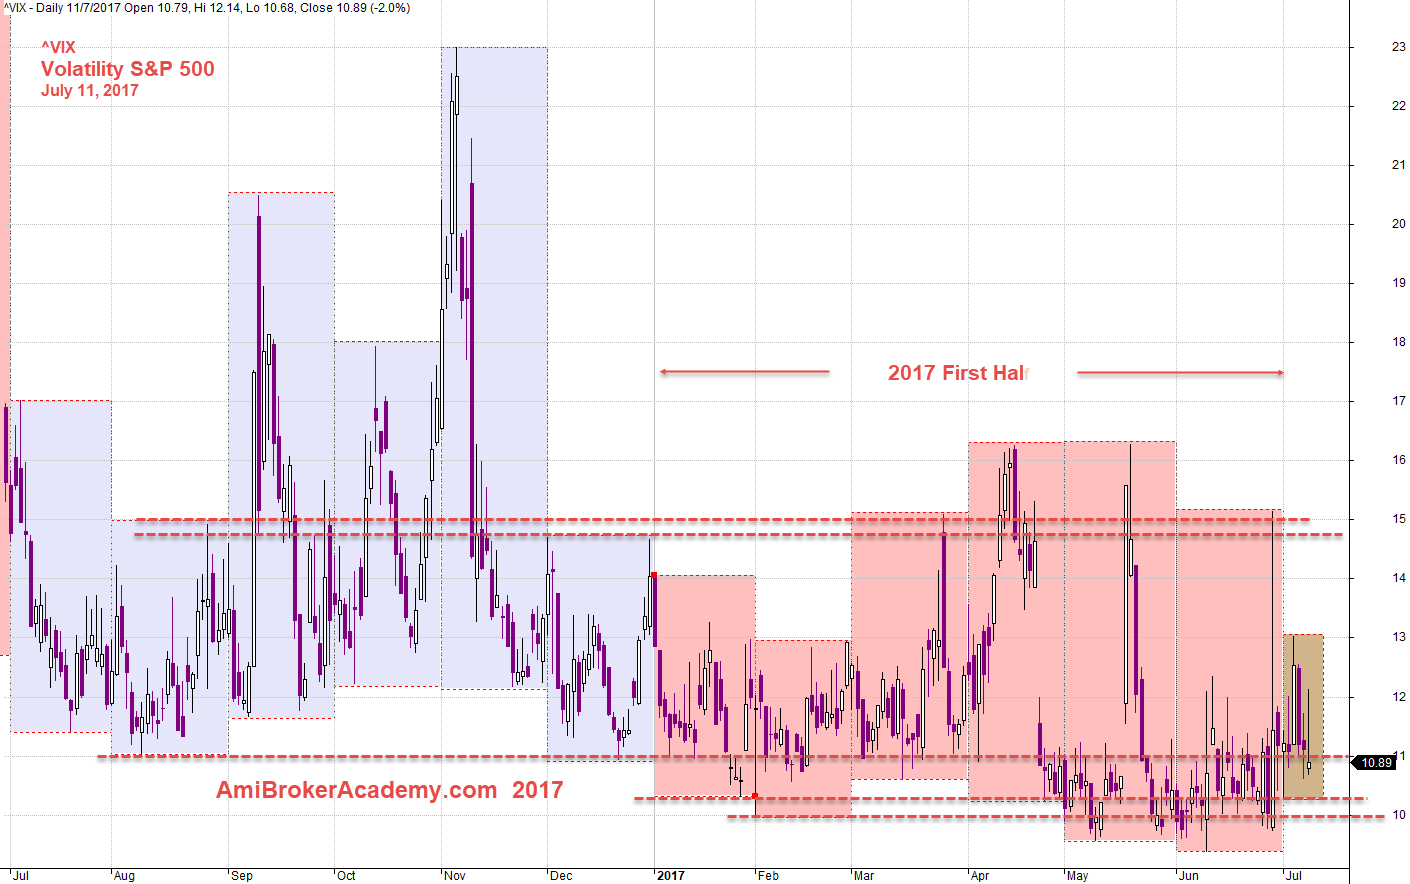
^VIX US Volatility Index
Picture worth a thousand words, see the colours it is easily for your to figure out, 2016 second half of the year and 2017 first half of the year.
2016 Second Half seems higher index than 2017 First Half. Why? Many will be able to name the different between these two periods, such as new cars, new something, new something, … Is it true because of the new elements? Don’t know. Just like drinking coffee, a group will say those drink can live longer. Another will disagree. At end, the bottom line is the state of the person health lah. So simple! If the person already has a bad DNA since young you think coffee can save him. You try!
Put aside all the different reasons, from the chart 2017 is definitely lower than 2016. Is this final? No lah! You have another six months to proof the picture is correct.
Scary Crystal Ball
Watch out! Some will scary the crystal ball to find answer. Not mean that, we mean watch the market and read the analysis here. Have fun!
July 11, 2017 ^VIX US Volatility Index and Support Resistance
Volatility Index ^VIX and Channel
Picture worth a thousand words, you can see from the chart with the channel, the index is bearish. The channel is slopping down from left to right, but not decline a lot.
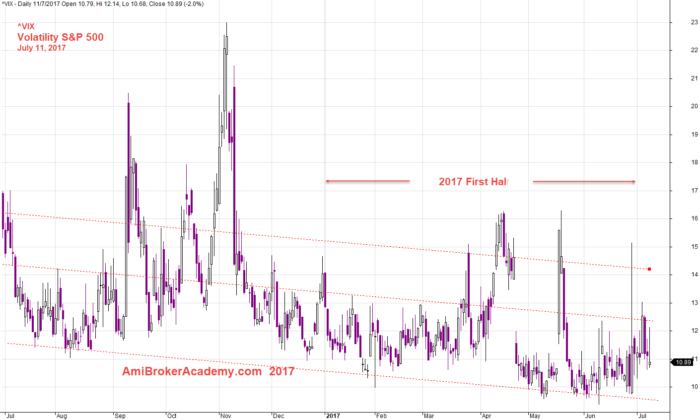
July 11, 2017 Volatility Index and Channel
First Six Months 2017 and Last Six Months 2016 ^VIX Channels
The channels draw show the index are more decline in 2017 first six months than the last six months of 2016. Means what? Needless to say.
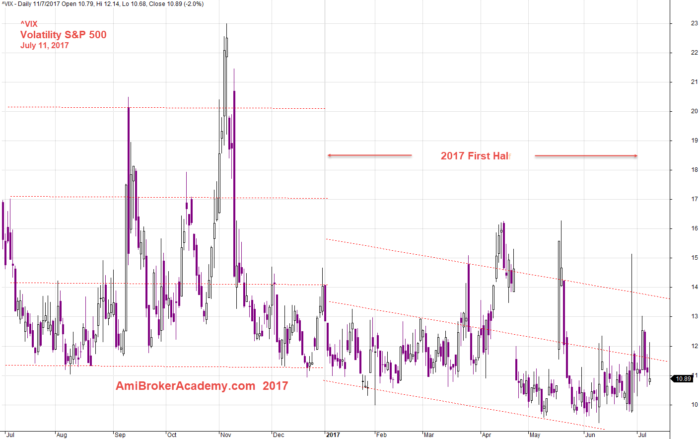
July 11, 2017 Volatility Index and Six Months Channels
US Volatility Index and MACD Signals
Picture worth a thousand words, the MACD strength can be clue to some of the future market development. Have fun learning.
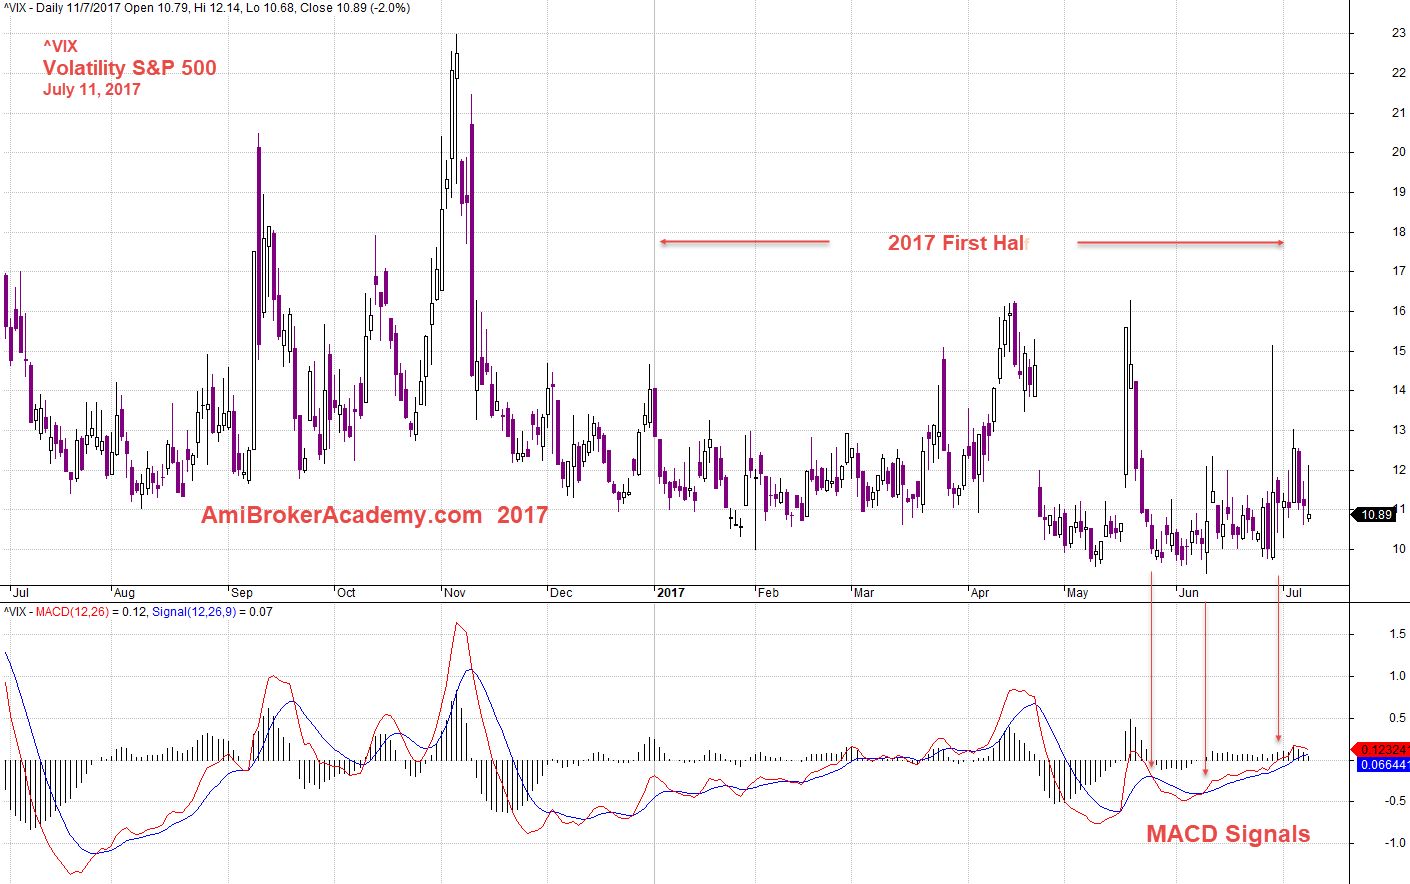
July 11, 2017 US ^VIX Volatility Index and MACD Signals
Moses Stock Analysis
AmiBrokerAcademy.com
Disclaimer
The above result is for illustration purpose. It is not meant to be used for buy or sell decision. We do not recommend any particular stocks. If particular stocks of such are mentioned, they are meant as demonstration of Amibroker as a powerful charting software and MACD. Amibroker can program to scan the stocks for buy and sell signals.
These are script generated signals. Not all scan results are shown here. The MACD signal should use with price action. Users must understand what MACD and price action are all about before using them. If necessary you should attend a course to learn more on Technical Analysis (TA) and Moving Average Convergence Divergence, MACD.
Once again, the website does not guarantee any results or investment return based on the information and instruction you have read here. It should be used as learning aids only and if you decide to trade real money, all trading decision should be your own.