Welcome to AmiBrokerAcademy.com.
Answer of Last Week Trading Plan:
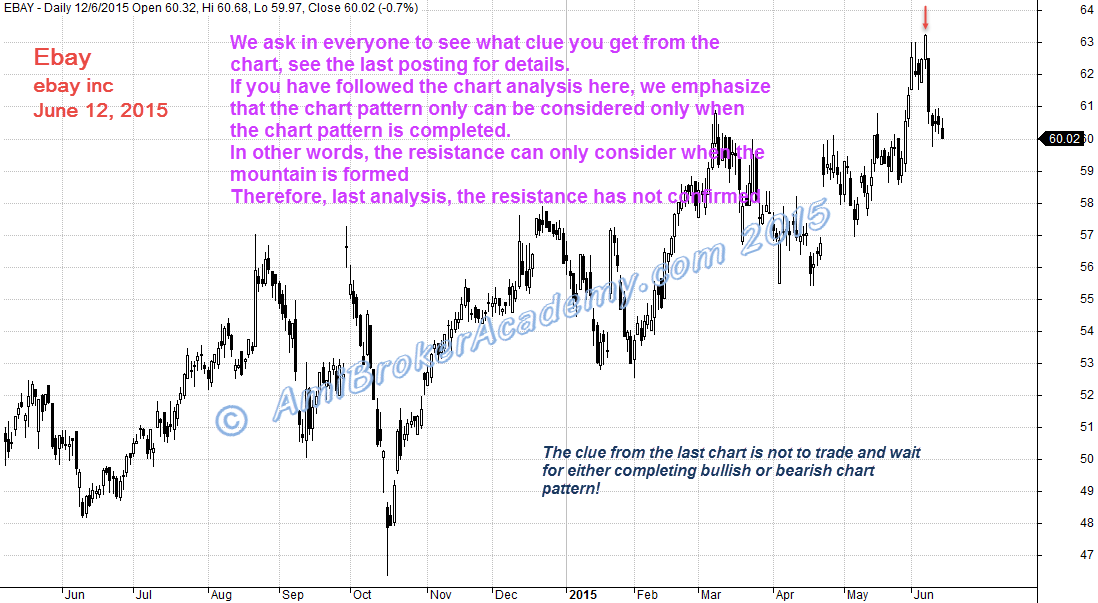
Last week, we asked you to analyse the chart and make the trading plan. From the chart, in fact we are not able to confirm whether PA has hit the resistance or ready for reversal. Why? Unless you see the completion for the price action, in our case here, price action hit resistance when you see a mountain, completed a bearish chart pattern.
We do not see any. Therefore the best trading plan is to stay aside and wait the price to show hand.
Hope you have the similar plan too.
What’s Next Week Plan?
We would like to share with you our trading plan for next week.
We tell you what we think for last week trading plan. From the June 5, 2015 chart, if you feel that you do not what to trade. In fact that is correct. The price action was half way to its completion.
This week, we can see the mountain has completed; you could easily draw the resistance line.
June 12, 2015 eBay Inc Trade Analysis
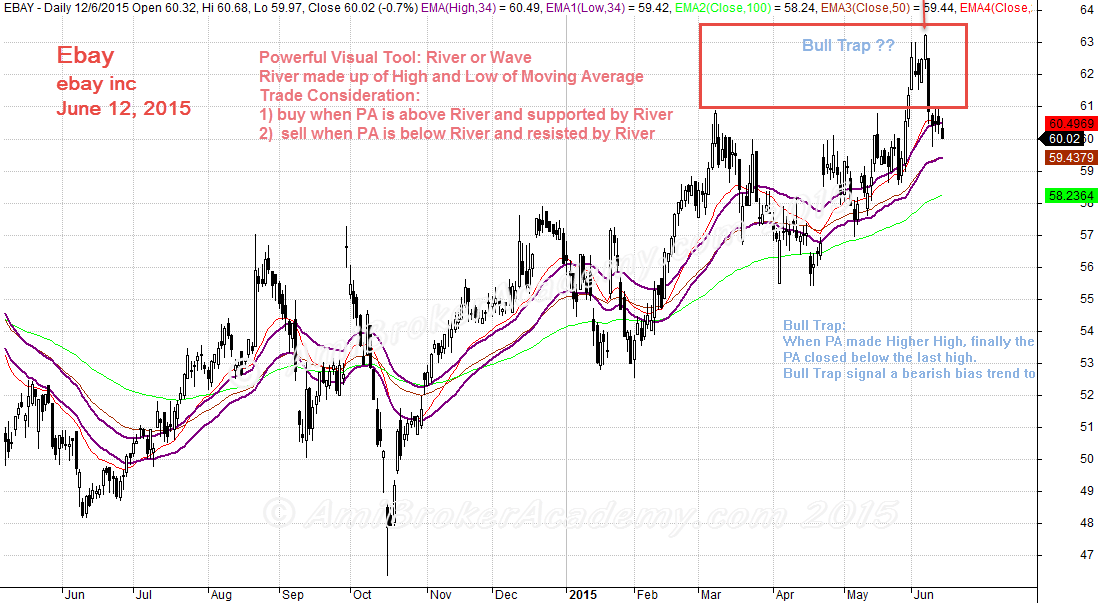
eBay Inc and River
River is a powerful visual tool, it is a luxury indicator. River sometimes also called wave. It made up by two moving averages, the high and low of the price of your choice. In our case here, we use 34. 34 is a fibonacci number.
You find sell opportunity when price action below River. You find buy opportunity when price above River.
June 12, 2015 eBay Inc and River
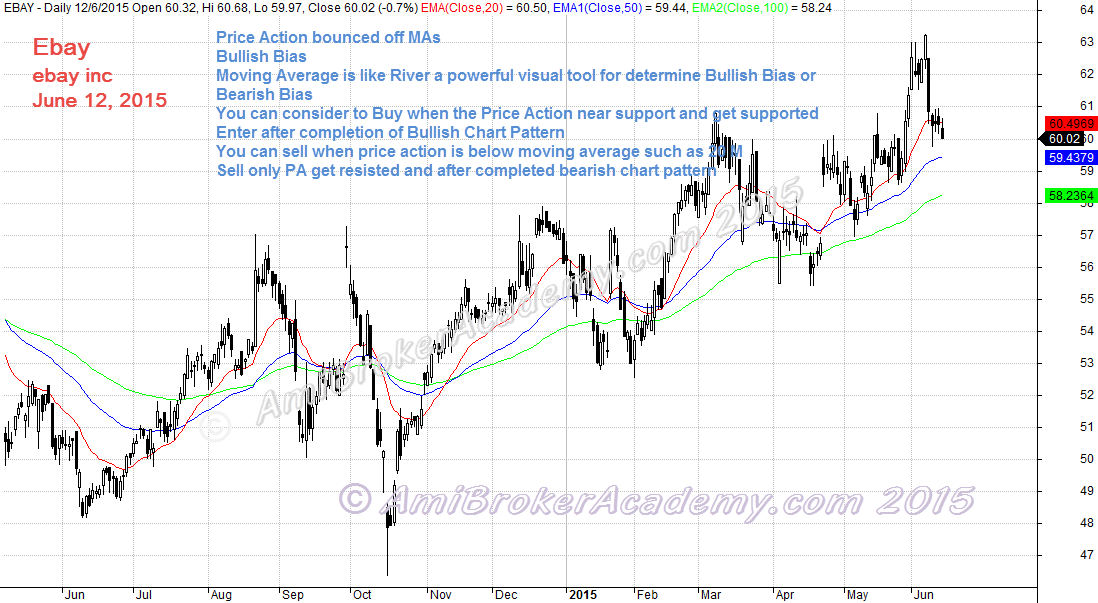
Next Best Visual Aids in Trading
Moving Average is the next best visual trading tool. To reduce risk, only consider sell when price below moving average such as 20 MA. For buy, when price above moving average.
June 12, 2015 eBay Inc
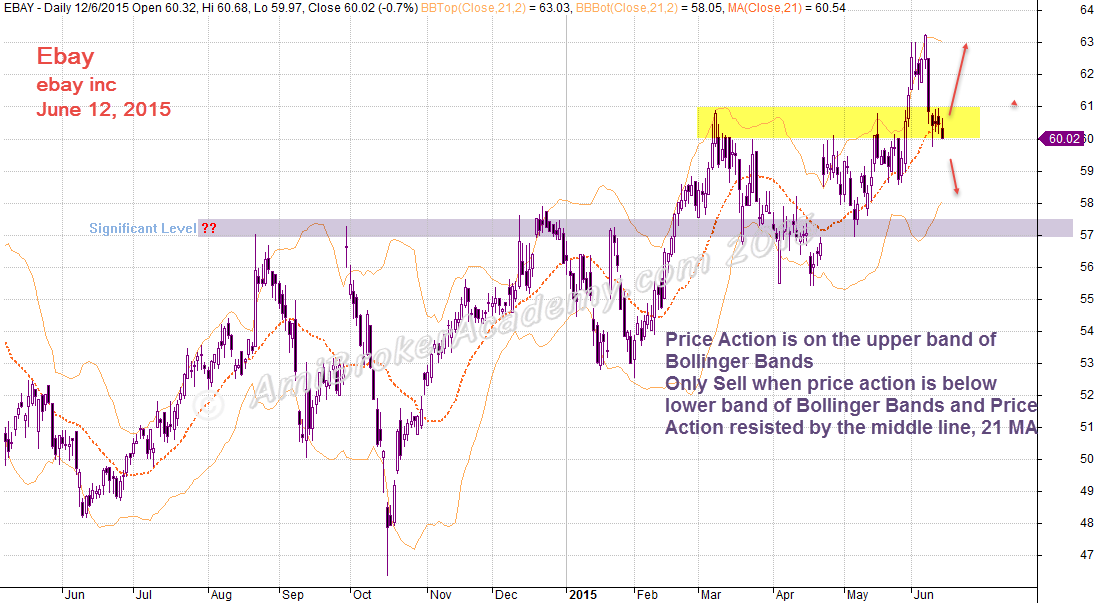
eBay Inc and Bollinger Bands
From the chart, the price action were within the upper band of Bollinger Bands. Can consider sell when price action start to bounce around in the lower bands.
June 12, 2015 eBay Inc and Bollinger Bands
So, What’s Next?
The price action is still very bullish bias. Only consider to sell when price action go below yellow band, but can be short term as the price will soon meet the significant level.
As price action still bullish bias, look out for opportunity to buy. Find price action near support, near significant support, enter only after completion of bullish chart pattern.
Have fun!
Thanks for visiting the website.
Moses
DISCLAIMER
Site advice, “Stock trading is not a get rich quick scheme and it is high risk”.
Information provided here is of the nature of a general comment only and no intend to be specific for trading advice. It has prepared without regard to any particular investment objectives, financial situation or needs. Information should NOT be considered as an offer or enticement to buy, sell or trade.
You should seek advice from your broker, or licensed investment advisor, before taking any action.
The website does not guarantee any results or investment return based on the information and instruction you have read here. It should be used as learning aids.