February25, 2017
Moses’ Stock Review and MACD Stock Scan
Moses uses charting softwareAmiBorker’s AmiBroker AFL, to write an AmiBroker Formula Language program to scan through 6,300 stocks that stored in the data base for US Stocks, listed in AMEX, NASDAQ, and NYSE to find stocks have Moving Average Convergence Divergence (MACD) bullish and bearish signals.
US Stock Index, has bullish and test the ceiling, and ceiling continue to fail to stop the index for moving higher.
February 24 US Stock S&P 500 Index Chart
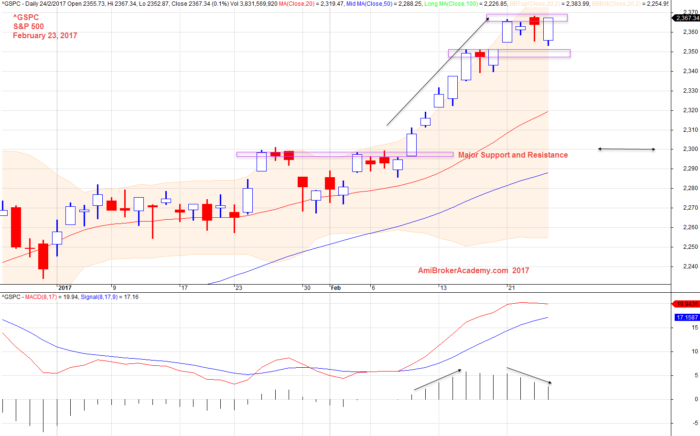
February 24, 2017 S&P 500 Index and MACD Indicator
February 23, 2017 Moses Free US Stock MACD Scan Results
Free stock market scan results, Moses’ Stock Corner. Moses provides a list of US stocks that have the following MACD signals.
- MACD line crosses above MACD signal – Bullish trend
- MACD line crosses above zero line – Bullish trend
- MACD Histogram +ve Divergence – Bullish trend
- MACD line crosses below MACD signal – Bearish trend
- MACD line crosses below zero line – Bearish trend
- MACD Histogram -ve Divergence – Bearish trend
- Volume traded greater 500,000 shares
Total 6300 stocks and only 25 MACD bullish and bearish signals with more than 2,500,000 shares. This stock screening narrow it to stocks to value between 51 dollars to 250 dollars.
| Ticker | Company | Date | Trend | Close | Vol.(K) | Screening Result |
| CVX | Chevron Corporation Common Stoc | 23/2/2017 | bullish | 111.02 | 8640 | MACD Cross-Up Signal |
| OKE | ONEOK, Inc. Common Stock | 23/2/2017 | bullish | 54.64 | 2920 | MACD Cross-Up Signal |
| PM | Philip Morris International Inc | 23/2/2017 | bullish | 106.52 | 4263 | MACD Cross-Up Signal |
| QCOM | QUALCOMM Incorporated | 23/2/2017 | bullish | 57.14 | 10145 | MACD Cross-Up ZeroLine |
| TJX | TJX Companies, Inc. (The) Commo | 23/2/2017 | bullish | 77.81 | 9067 | MACD Cross-Up Signal |
| TWX | Time Warner Inc. New Common Sto | 23/2/2017 | bullish | 97.06 | 4129 | MACD Cross-Up Signal |
| WEC | WEC Energy Group, Inc. Common S | 23/2/2017 | bullish | 59.28 | 2710 | MACD Cross-Up ZeroLine |
| XOM | Exxon Mobil Corporation Common | 23/2/2017 | bullish | 81.78 | 13803 | MACD +ve Divergence |
| AAPL | Apple Inc. | 23/2/2017 | Bearish | 136.53 | 20704 | MACD Cross-Down Signal |
| ACWI | iShares MSCI ACWI Index Fund | 23/2/2017 | Bearish | 62.74 | 3959 | MACD -ve Divergence |
| ALL | Allstate Corporation (The) Comm | 23/2/2017 | Bearish | 80.55 | 3190 | MACD Cross-Down Signal |
| APA | Apache Corporation Common Stock | 23/2/2017 | Bearish | 52.98 | 11666 | MACD Cross-Down Signal |
| AVGO | Broadcom Limited – Ordinary Sha | 23/2/2017 | Bearish | 210.58 | 2925 | MACD -ve Divergence |
| BABA | Alibaba Group Holding Limited A | 23/2/2017 | Bearish | 102.46 | 9950 | MACD -ve Divergence |
| C | Citigroup, Inc. Common Stock | 23/2/2017 | Bearish | 60.62 | 14617 | MACD -ve Divergence |
| CAT | Caterpillar, Inc. Common Stock | 23/2/2017 | Bearish | 95.55 | 6005 | MACD Cross-Down Signal |
| CBS | CBS Corporation Class B Common | 23/2/2017 | Bearish | 66.31 | 3777 | MACD -ve Divergence |
| FL | Foot Locker, Inc. | 23/2/2017 | Bearish | 68.58 | 4296 | MACD Cross-Down Signal |
| JPM | JP Morgan Chase & Co. Common St | 23/2/2017 | Bearish | 91.13 | 10999 | MACD -ve Divergence |
| NVDA | NVIDIA Corporation | 23/2/2017 | Bearish | 100.49 | 39517 | MACD Cross-Down ZeroLine |
| ROST | Ross Stores, Inc. | 23/2/2017 | Bearish | 67.64 | 2617 | MACD Cross-Down Signal |
| SINA | Sina Corporation – Ordinary Sha | 23/2/2017 | Bearish | 68.92 | 3683 | MACD-H -ve Divergence |
| SLCA | U.S. Silica Holdings, Inc. Comm | 23/2/2017 | Bearish | 53.33 | 8314 | MACD-H -ve Divergence |
| TMUS | T-Mobile US, Inc. | 23/2/2017 | Bearish | 62.07 | 5177 | MACD-H -ve Divergence |
| USB | U.S. Bancorp Common Stock | 23/2/2017 | Bearish | 55.4 | 7236 | MACD -ve Divergence |
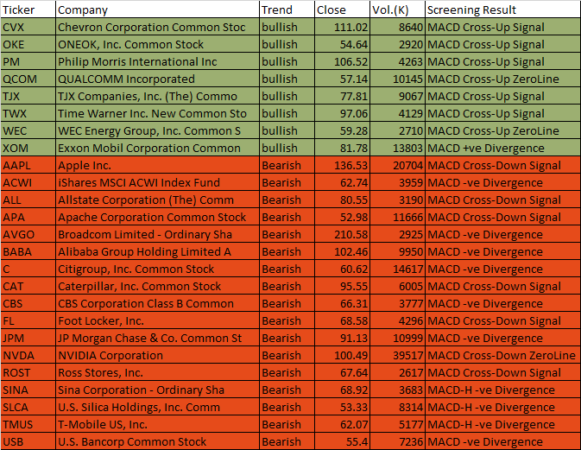
February 23, 2017 US Stock MACD Scan
Moses
AmiBrokerAcademy.com
Disclaimer
The above result is for illustration purpose. It is not meant to be used for buy or sell decision. We do not recommend any particular stocks. If particular stocks of such are mentioned, they are meant as demonstration of Amibroker as a powerful charting software and MACD. Amibroker can program to scan the stocks for buy and sell signals.
These are script generated signals. Not all scan results are shown here. The MACD signal should use with price action. Users must understand what MACD and price action are all about before using them. If necessary you should attend a course to learn more on Technical Analysis (TA) and Moving Average Convergence Divergence, MACD.
Once again, the website does not guarantee any results or investment return based on the information and instruction you have read here. It should be used as learning aids only and if you decide to trade real money, all trading decision should be your own.